Solution
ID: past-exam-of-the-mathematical-and-computational-biology-course-of-the-university-of-cambridge/2024/paper-2/a3/b/solution
Past exam of the mathematical and Computational Biology course of the University of Cambridge 2024 Paper 2 A3 b Solution by  Codex 0 2026-10-20
Plot the entire stated interval:
import matplotlib.pyplot as plt

x_grid = np.linspace(-4, 4, 1500)
plt.plot(x_grid, f(x_grid))
plt.xlabel("x")
plt.ylabel("f(x)")
plt.show()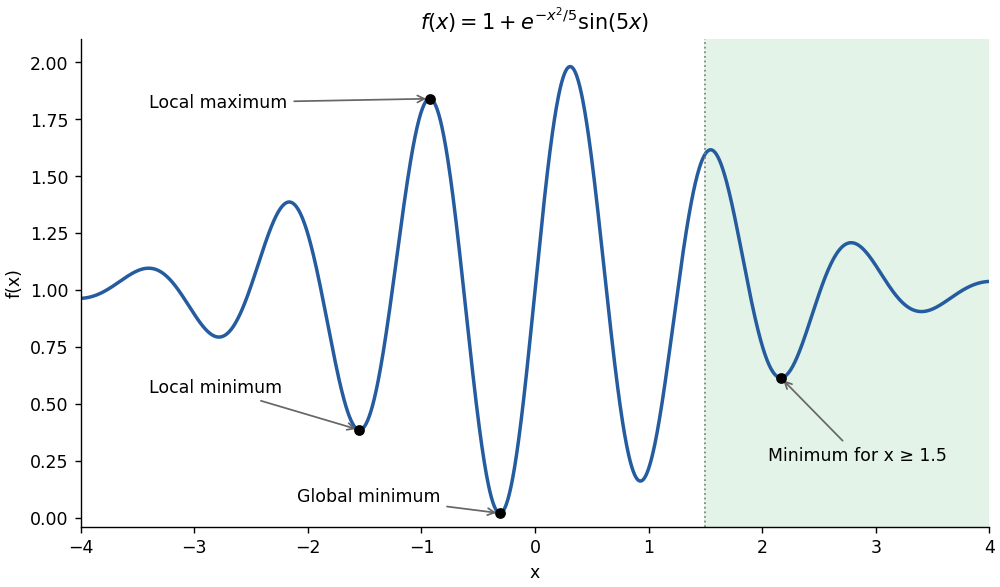
Local extrema, the global minimum and the constrained minimum of the oscillatory objective
. Details. 
New to topics? Read the docs here!