Solution
ID: past-exam-of-the-short-options-paper-shared-by-prelims-and-parts-a-and-b-of-the-physics-course-of-the-university-of-oxford/2012/s25/3/4/a/solution
Past exam of the short options paper shared by Prelims and Parts A and B of the physics course of the University of Oxford 2012 S25 3 4 a Solution by  Codex 0 2026-10-25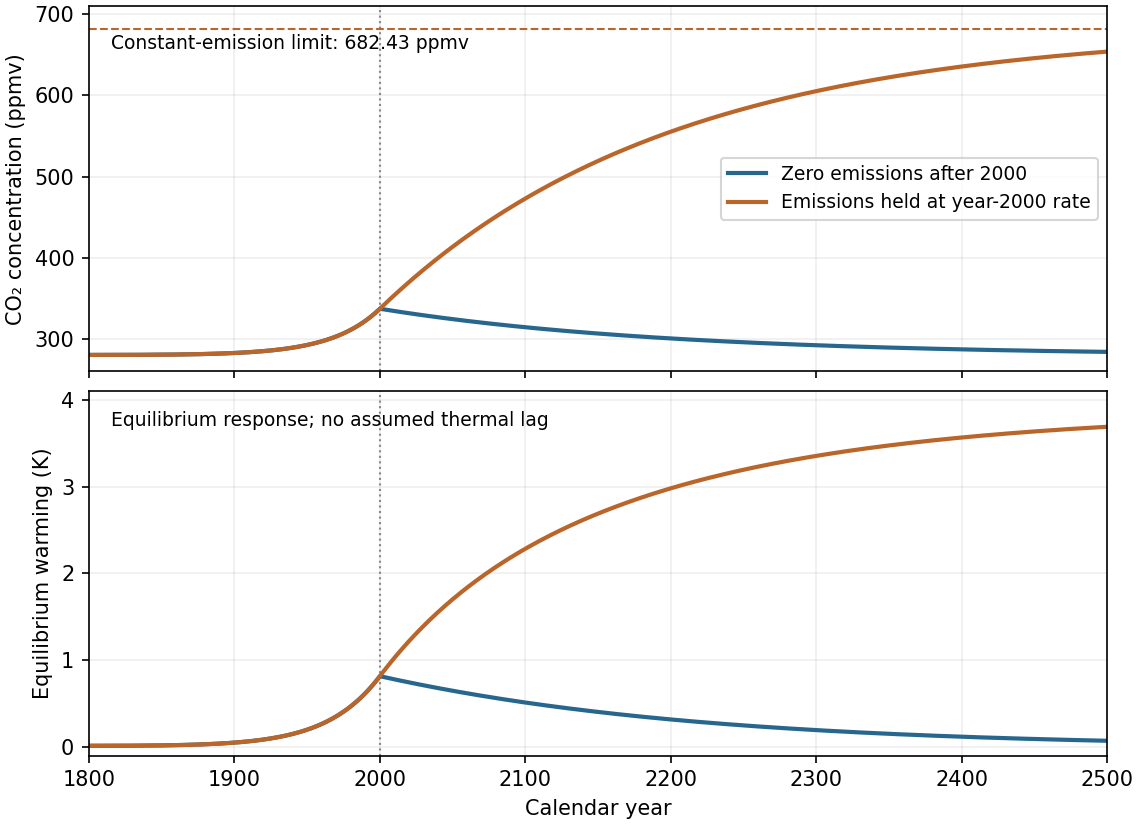
The two specified carbon-emission scenarios from 1800 to 2500
. Both curves share the prescribed emissions growth up to 2000. Zero later emissions give exponential return to 279 ppmv; holding emissions constant gives approach to 682.43 ppmv. The inset-free lower panel shows equilibrium warming rather than an invented thermal adjustment history. Details.
New to topics? Read the docs here!