Solution
ID: past-exam-of-the-systems-biology-course-of-the-university-of-cambridge/2024/paper-3/3/b/solution
Past exam of the systems biology course of the University of Cambridge 2024 Paper 3 3 b Solution by  Codex 0 2026-10-20
For a constant , set both ordinary differential equation derivatives to zero:These equilibrium concentrations are unique for each input. For a loss rate other than one, divide the corresponding production term by .
Choose , , and , , . The following Python code plots the requested equilibrium concentrations and defines the functions used in part (c):
import numpy as np
import matplotlib.pyplot as plt

def hill(u, K, n):
    u = np.asarray(u)
    return u**n / (K**n + u**n)

X_grid = np.linspace(0, 5, 501)
Y_eq = 2 * hill(X_grid, 1, 2)
Z_eq = 3 * hill(X_grid, 2, 4)
plt.figure(figsize=(6, 4))
plt.plot(X_grid, Y_eq, label="Y equilibrium: K=1, n=2")
plt.plot(X_grid, Z_eq, label="Z equilibrium: K=2, n=4")
plt.xlabel("X concentration")
plt.ylabel("Equilibrium concentration")
plt.legend()
plt.tight_layout()
plt.show()
The Hill constant sets the half-maximum input: and . Increasing that constant shifts activation toward larger . The Hill coefficient changes steepness rather than the half-maximum position; the normalized slope at is . Because the two examples also differ in and maximal production, compare normalized responses when isolating the effect of alone. Both curves vanish at zero and saturate toward their respective maxima.
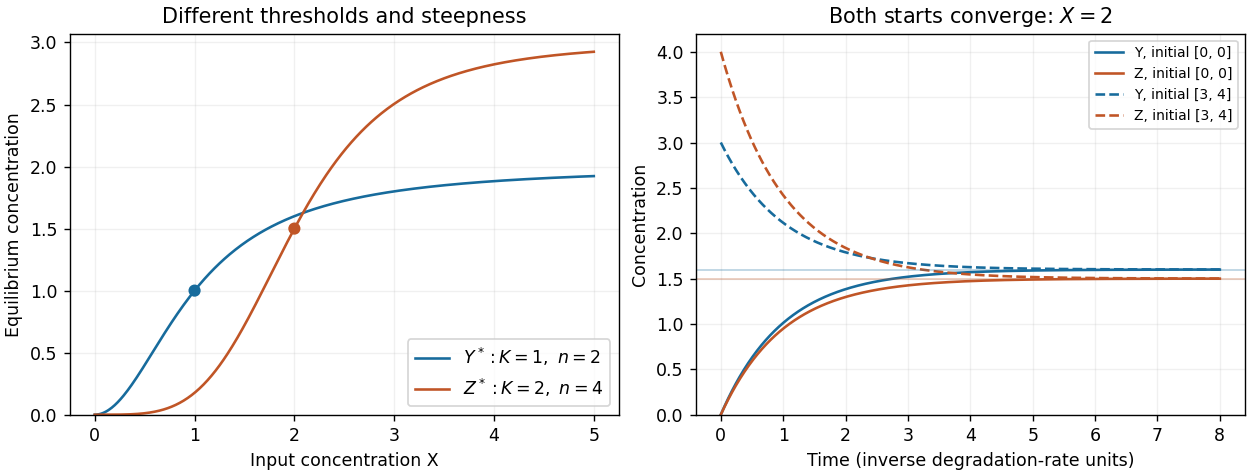
Independent Hill activation and convergence from two initial states
. The left panel shows different half-activation inputs and Hill coefficients. The right panel integrates the two independent output equations at fixed X=2; dashed curves start above equilibrium and solid curves start at zero. Details.
New to topics? Read the docs here!