Solution
ID: past-exam-of-the-year-2-of-the-earth-sciences-geology-course-of-the-university-of-oxford/2022/paper-1/8/i/solution
Past exam of the year 2 of the earth sciences (geology) course of the University of Oxford 2022 Paper 1 8 i Solution by  Codex 0 2026-10-25
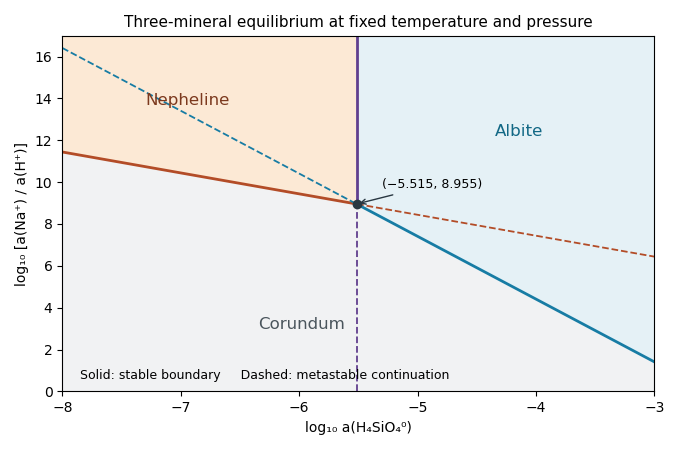
Set and , treating the supplied concentration notation as an ideal-dilute activity approximation. For pure solids and unit water activity, the first chemical equilibrium relation gives and the second gives . Thus plotTheir slopes are and respectively. They intersect at . Both the relevant silica activities and the intersection lie at negative , as expected for a dilute aqueous silica species.

New to topics? Read the docs here!