PCR verification with gel electrophoresis
ID: oxford-nanopore-river-bacteria/pcr-verification-with-gel-electrophoresis
How to use an Oxford Nanopore MinION to extract DNA from river water and determine which bacteria live in it PCR verification with gel electrophoresis by  Ciro Santilli 40 Updated 2025-07-16
For this reason, it is wise to verify that certain steps are correct whenever possible.
Gel electrophoresis separates molecules by their charge-to-mass ratio. It is one of those ultra common lab procedures!
Since we know that we amplified the 16S regions which we know the rough size of (there might be a bit of variability across species, but not that much), we were expecting to see a big band at that size.
And that is exactly what we saw!
First we had to prepare the gel, put the gel comb, and pipette the samples into wells present in the gel:
To see the DNA, we added ethidium bromide to the samples, which is a substance that that both binds to DNA and is fluorescent.
Because it interacts heavily with DNA, ethidium bromide is a mutagen, and the biology people sure did treat the dedicated electrophoresis bench area with respect! Figure 4. "Gel electrophoresis dedicated bench area to prevent ethidium bromide contamination.".
Gel electrophoresis dedicated bench area to prevent ethidium bromide contamination.
Source. Gel electrophoresis dedicated waste bin for centrifuge tubes and pipette tips contaminated with ethidium bromide.
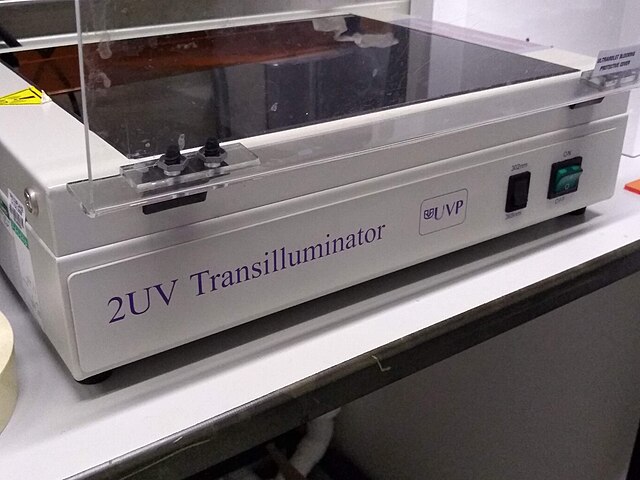
Source. The UV transilluminator we used to shoot UV light into the gel was the Fisher Scientific UVP LM-26E Benchtop 2UV Transilluminator. The fluorescent substance then emitted a light we can see.
As barely seen at Figure 8. "Fischer Scientific UVP LM-26E Benchtop 2UV Transilluminator illuminated gel." due to bad photo quality due to lack of light, there is one strong green line, which compared to the ladder matches our expected 16S length. What we saw it with the naked eyes was very clear however.
New to topics? Read the docs here!


