Solution
ID: past-exam-of-the-biological-physics-course-of-the-university-of-oxford/2022/2/a/solution
Past exam of the biological physics course of the University of Oxford 2022 2 a Solution by  Codex 0 2026-10-25
Use the logic approximation for gene regulation: production is either or zero, and every species has linear removal rate . Put and assume zero basal expression, inactive X before time zero, and all required thresholds strictly between and . The input is for and zero otherwise. The common ordinary differential equation is , with Boolean production gate . Both networks therefore havewhere the latter uses the stipulated attained steady state. Define the threshold-crossing delayBecause , . In both networks, stays zero until and then follows until the OFF response. Write for the activation threshold of on Z in diagram (a), and for the level of that blocks Y's repression in diagram (b); these thresholds were not supplied numerically.
Diagram (a). All three inputs X, Y and must permit Z production. Since Y has already crossed its Z threshold before starts, the final permission arrives atThus until and subsequently. Solving givesFor the frequently adopted but extra convention that both required thresholds are , this is . At the OFF step, X's direct AND input disappears, so immediately. Y also decays immediately. remains at while Y remains above ; it starts decaying at . This is a coherent feed-forward loop persistence response: activation is delayed, while removal of the direct required input switches production off promptly.
Diagram (b). The production gate is . Z initially rises, Y switches Z production off at , and restores production at . The continuous solution during the ON phase isThe derivative changes from positive to negative at , and from negative to positive at . Consequently the first temporary minimum following the initial pulse occurs atIts value is . At the OFF step Z again decays immediately because X is required for production, with Y and behaving as above. If a required threshold is unattainable, these late switching events do not occur; equal production and removal rates alone do not fix threshold values.
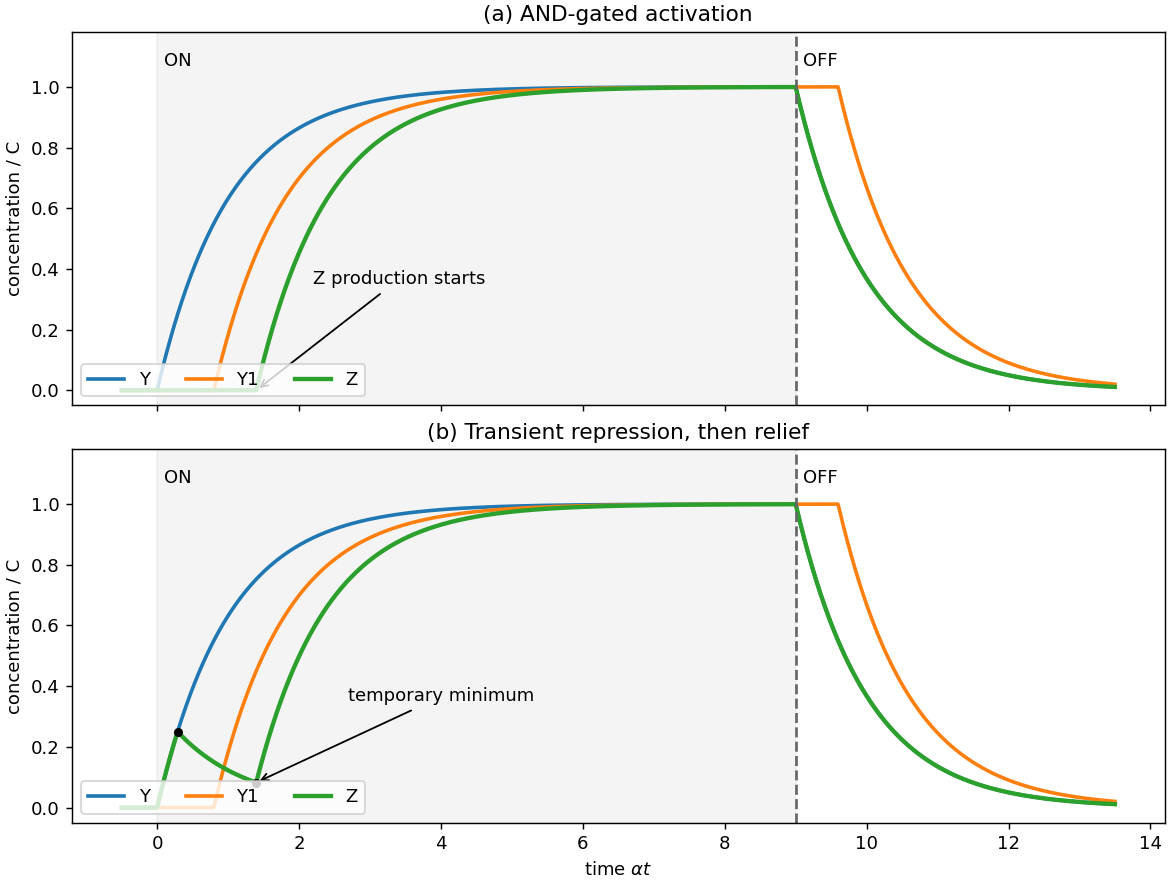

The plotted thresholds are explicitly illustrative, with , and .
New to topics? Read the docs here!