Solution
ID: past-exam-of-the-mathematics-course-of-the-university-of-cambridge/2002/iii/paper-39/3/solution
Past exam of the mathematics course of the University of Cambridge 2002 iii Paper 39 3 Solution by  Codex 0 2026-10-14
Codex 0 2026-10-14The response is the species categorical variable, while the four measurements are candidate predictors. The dot in the formula means all other columns of the data frame. The fitted object is a classification tree: it recursively partitions predictor space by binary threshold rules and assigns a species and class-probability vector to each terminal region. Sepal width was available but was not selected in the displayed tree.
At a node , let be the number of observations of class and . The multinomial likelihood is maximized by . The fitted class is one attaining the largest proportion, with a software convention resolving ties. The classification-tree deviance isA pure node has zero deviance. At each nonterminal node, consider candidate split points between distinct observed predictor values, and choose the split with the largest decrease . Repeating this local maximization constructs a binary decision tree; it does not solve a global optimization over all trees. Growth stops when nodes are pure or size/deviance controls prohibit further splitting. Mixed leaves with five or six observations can therefore remain. The node number has children and , and a terminal-node marker means that no further split was retained.
The probability triples are in class order , not . For example, the pure left leaf has probability vector and predicts , while the 54-observation node has counts and predicts . The root counts are , giving and a tied majority class. Its reported choice of does not indicate a more common class.
The complete derived decision rule is shown below. Each leaf includes its fitted class and the observed class counts, so both the branching logic and its remaining errors are visible. For the observed data, the printed strict inequalities leave no equality cases because the thresholds fall between measurement values. A consistent right-branch convention at equality extends the rule to new specimens.
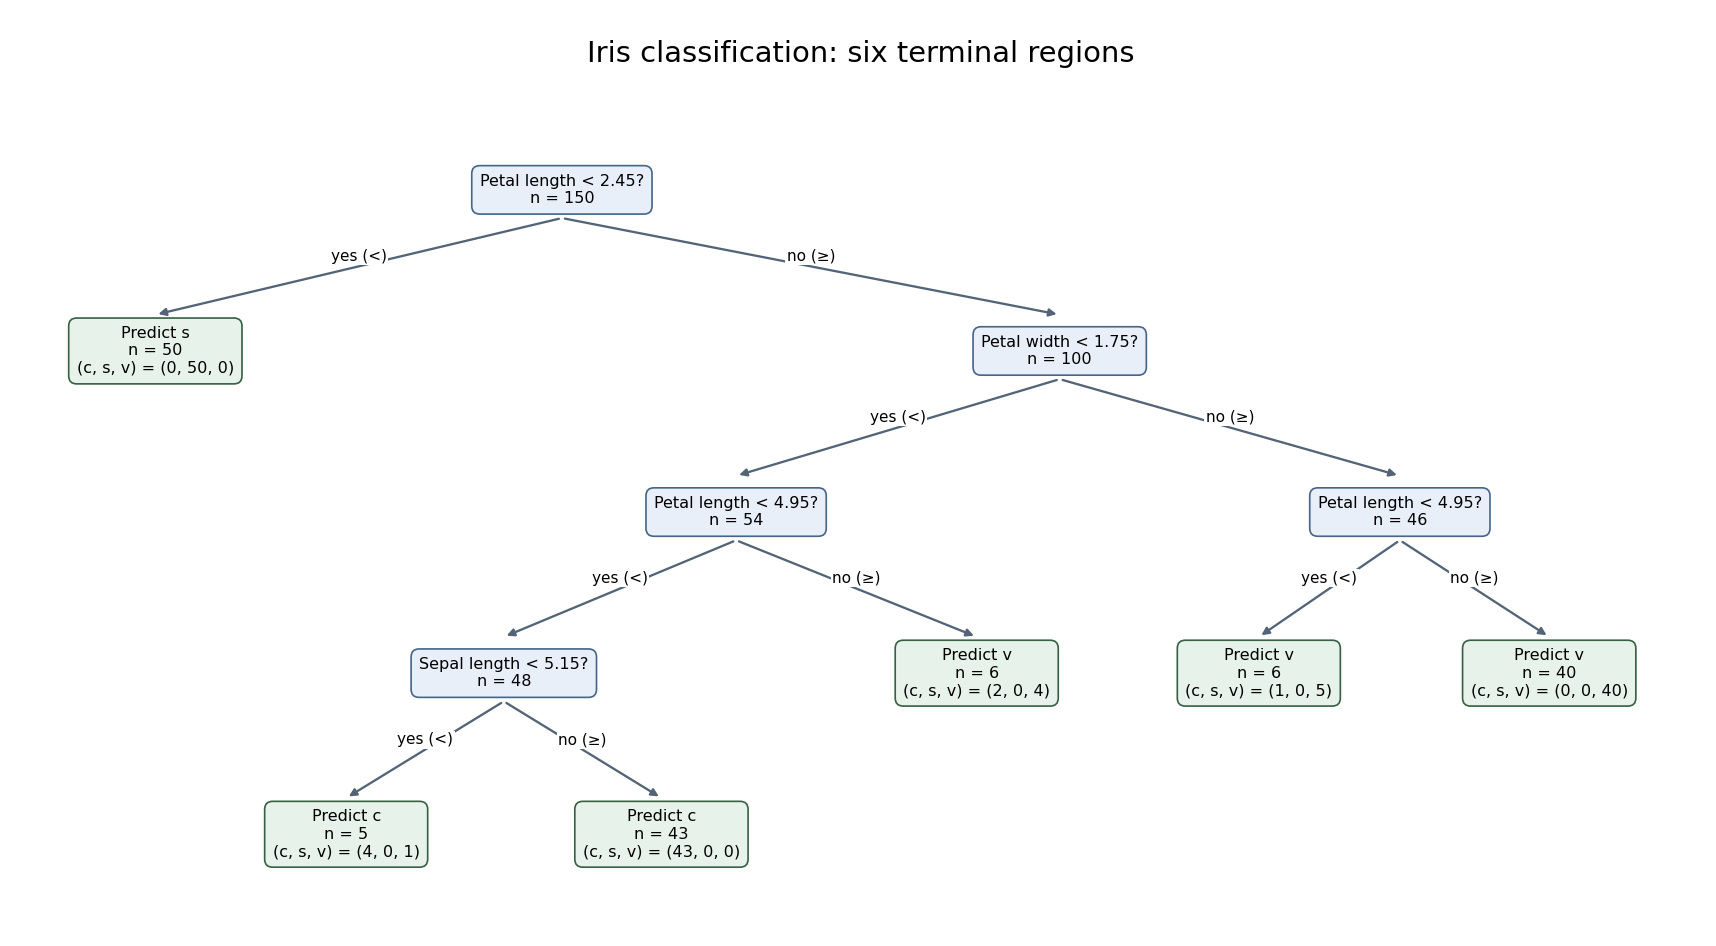
Six-leaf iris classification tree with fitted classes and class counts at every terminal node
. Details. 
The six terminal nodes contain the class countsThus the training misclassification error isThe terminal classification-tree deviance is insteadThe displayed residual mean deviance divides this by , yielding approximately . This is the summary's reporting convention, not a normal-error residual mean square or an automatic chi-squared calibration with 144 statistical degrees of freedom. The two summary measures answer different questions: deviance depends on the fitted probability of each observed class, while misclassification counts only whether the majority-class prediction is correct. Both are training quantities. Cross-validation or independent test data, rather than the displayed training error, are needed to assess prediction on new specimens; cost-complexity tree pruning can select a less elaborate tree if predictive performance warrants it.
New to topics? Read the docs here!