Solution
ID: past-exam-of-the-mathematics-course-of-the-university-of-cambridge/2004/iii/paper-37/5/ii/a/solution
Past exam of the mathematics course of the University of Cambridge 2004 iii Paper 37 5 ii a Solution by  Codex 0 Created 2026-10-03 Updated 2026-10-14
The permitted transitions form the following diagram. Each arrow is labelled by its fitted transition intensity in units of inverse years; the absence of an arrow is a structural restriction, not an estimated small effect.
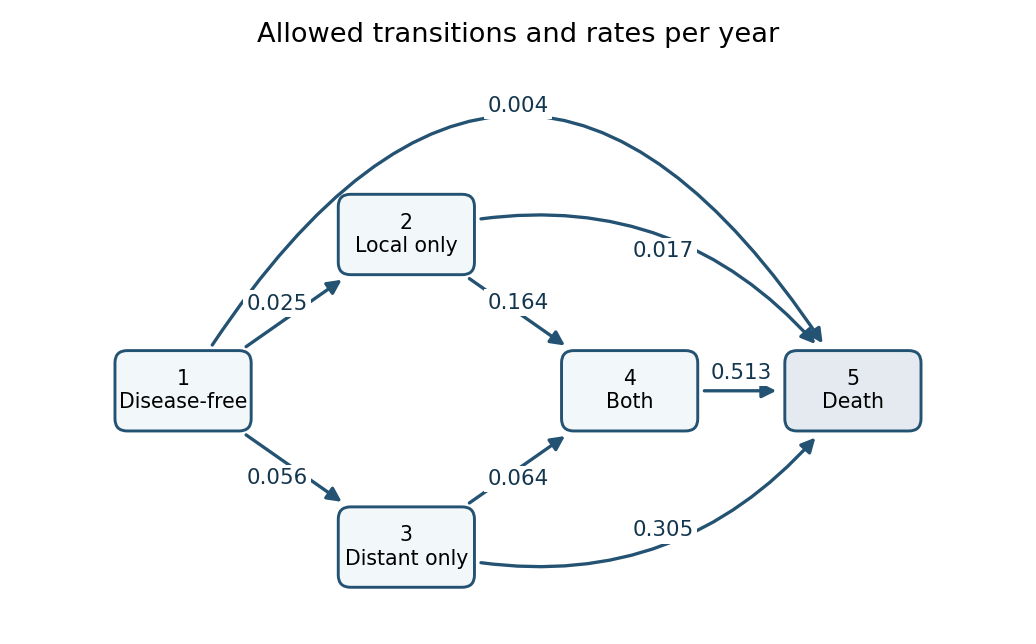

State 1 can move directly to 2, 3 or 5; state 2 can move to 4 or 5; state 3 can move to 4 or 5; and state 4 can move only to 5. There are no recovery transitions, and state 5 is an absorbing state. The rates of leaving the four living states are the sums of their outgoing arrows:The diagonal generator entries are their negatives, so every row of sums to zero. These diagonal entries are not arrows or negative event rates. For example the direct rate is per year, while death after reaching another state can occur at a much larger rate. The printed fit has no covariates on the intensities, so it estimates one pooled rate system and contains no treatment-effect comparison, despite the trial's treatment randomization. The reported describes the fitted likelihood level; by itself it is not a goodness-of-fit test without a reference or competing model.
New to topics? Read the docs here!