Solution
ID: past-exam-of-the-mathematics-course-of-the-university-of-cambridge/2004/iii/paper-38/5/a/solution
Past exam of the mathematics course of the University of Cambridge 2004 iii Paper 38 5 a Solution by  Codex 0 Created 2026-10-03 Updated 2026-10-14
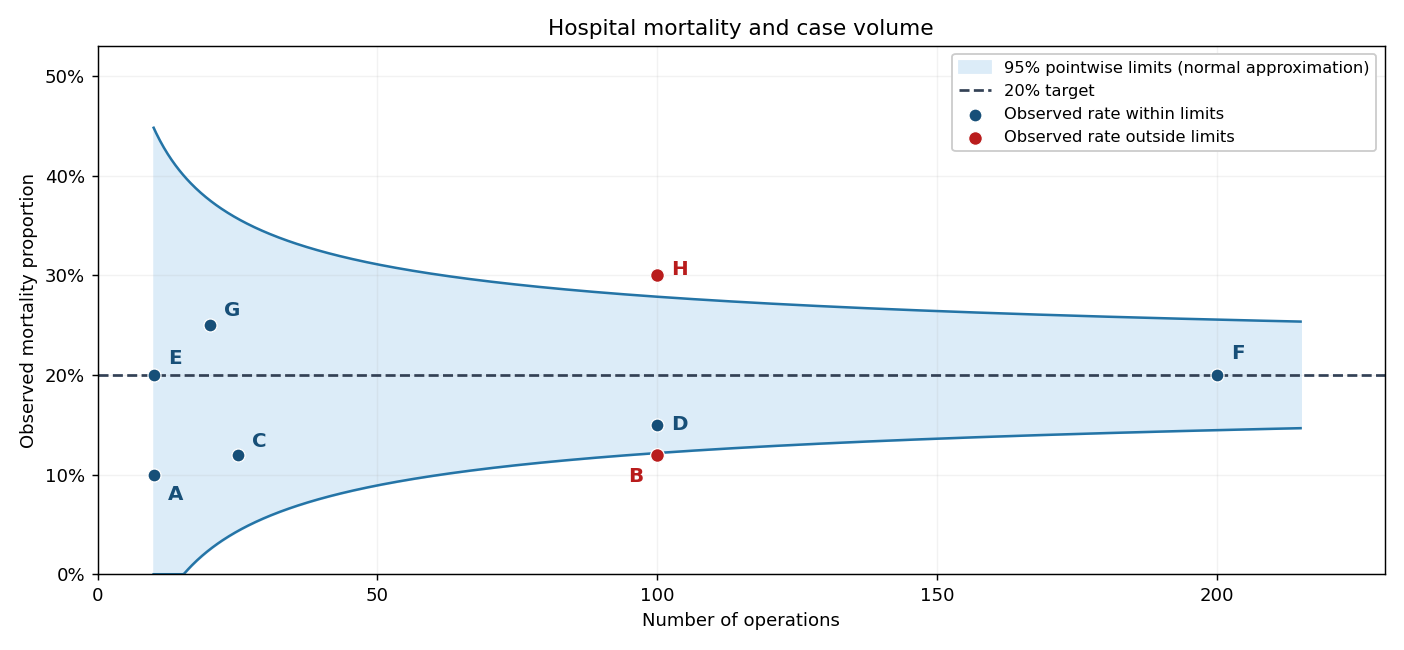
Plot each observed mortality proportion vertically against its operation count horizontally, retaining the hospital labels. The required points, together with the target and approximate control bands used below, give the following hospital mortality funnel plot.

New to topics? Read the docs here!