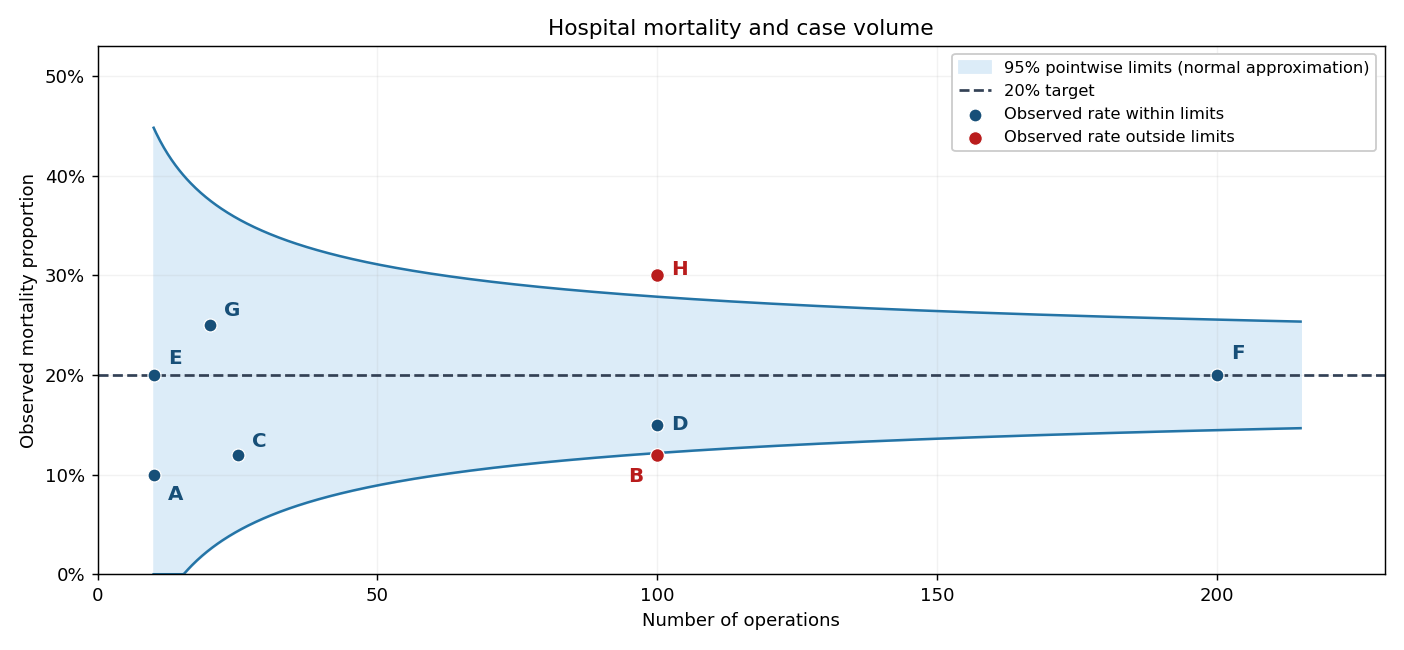
Plot each observed mortality proportion vertically against its operation count horizontally, retaining the hospital labels. The required points, together with the target and approximate control bands used below, give the following hospital mortality funnel plot.

Articles by others on the same topic
There are currently no matching articles.