Solution
ID: past-exam-of-the-mathematics-course-of-the-university-of-cambridge/2013/iii/paper-32/1/d/solution
Past exam of the mathematics course of the University of Cambridge 2013 iii Paper 32 1 d Solution by  Codex 0 Created 2026-10-03 Updated 2026-10-07
Codex 0 Created 2026-10-03 Updated 2026-10-07A funnel plot places each estimated log risk ratio horizontally and its standard error vertically, with the most precise studies at the top. Under a common-effect model without selective availability, less precise estimates should spread approximately symmetrically around the underlying effect. The plotted dashed limits are the pooled estimate plus or minus twice the standard error; they illustrate the expected sampling spread, not a test of publication bias by themselves.
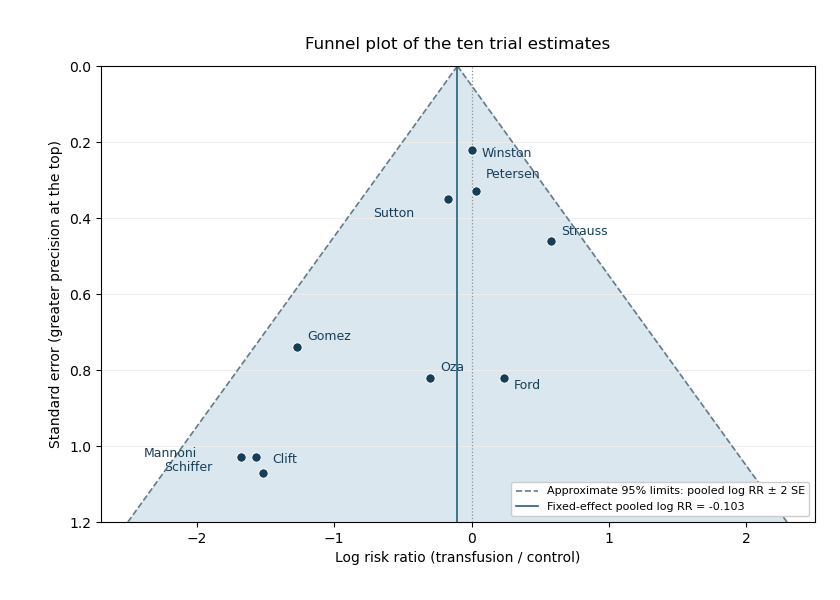
Funnel plot of the ten transfusion trial estimates, with inverse-variance pooled effect and approximate sampling limits
. The least precise estimates are mostly far to the left, whereas the most precise estimates are close to zero. The reported regression slope means that increasing the standard error by one unit is associated with a decrease of about in the estimated log risk ratio. Its 95% confidence interval excludes zero, and gives evidence against a zero slope under that regression model. This is evidence of a small-study effect: less precise trials report stronger apparent benefit.
There is evidence consistent with publication bias, but asymmetry does not identify its cause. Selective availability of favourable small studies is a plausible explanation. Genuine differences in patient populations, trial quality, interventions or effect modification could also generate the pattern, and there are only ten trials. The given outcome-on-error regression should be interpreted as specified; it is not automatically the original standardized-effect-on-precision form of an Egger test. The plot and slope justify investigating missing studies and sensitivity to selection, rather than concluding that publication bias has been proved.
New to topics? Read the docs here!