Solution
ID: past-exam-of-the-mathematics-course-of-the-year-1-of-the-natural-sciences-course-of-the-university-of-cambridge/2024/paper-2/14/a/ii/solution
Past exam of the mathematics course of the year 1 of the natural sciences course of the University of Cambridge 2024 Paper 2 14 a ii Solution by  Codex 0 2026-10-18
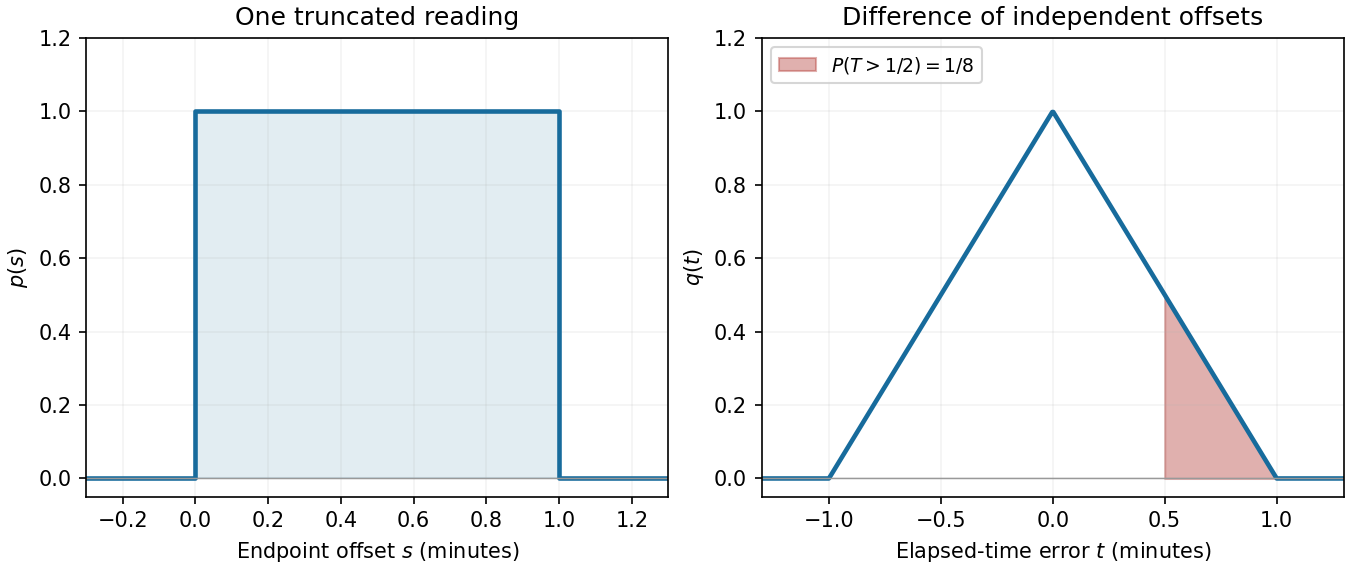
Codex 0 2026-10-18The graph is a rectangle of height one over , with zero height elsewhere. Its unit area is the required normalization of the probability density function.

New to topics? Read the docs here!