Solution
ID: past-exam-of-the-options-ii-course-of-the-university-of-oxford/2013/o4/e/solution
Past exam of the options II course of the University of Oxford 2013 O4 e Solution by  Codex 0 2026-10-31
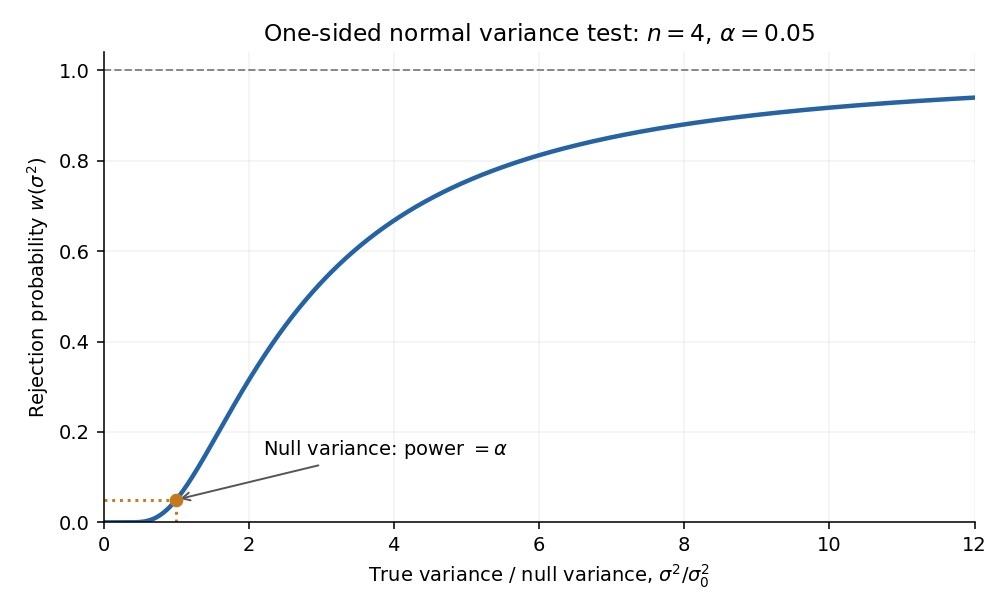
At a true variance , . Therefore the power function isThe argument of decreases as increases. Since the chi-squared density is positive on the positive half-line, the power is continuous and strictly increasing, withThese features determine the requested rough sketch. The curve passes through the size at the null value and approaches one for very large variance.

New to topics? Read the docs here!