
Curie temperature Updated 2025-07-16

Superconducting phase diagram Created 2024-10-06 Updated 2025-07-16
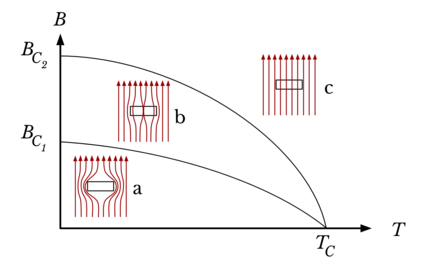
There are various possibilities for the axes, but some common ones:
- temperature (T) vs magnetic field strength (B)
- temperature (T) vs proportion of each chemical element of a binary alloy
- temperature (T) vs pressure
