Topics (318k) Articles (329k) Users (384) Discussions (237) Comments (383) Files (10k) New article

Digital topology is a branch of topology that deals with the properties and structures of digital images, particularly in the context of discrete spaces. Digital topology aims to extend classical topological concepts to digital representations, which are typically composed of pixel grids or voxel volumes in two or three dimensions, respectively. Key aspects of digital topology include: 1. **Discretization**: In digital spaces, points are represented by discrete elements (e.g.
Visualization, in the context of graphics, refers to the representation of data or concepts through visual means. This process involves transforming complex data sets or abstract ideas into visual formats, making them easier to understand, analyze, and communicate. Visualization can include various forms and techniques, such as: 1. **Charts and Graphs**: Commonly used to represent numerical data, such as bar charts, line graphs, pie charts, and histograms.
Visual analytics is an interdisciplinary field that combines data analysis, visualization, and human-computer interaction to help users interpret complex data sets. It involves the use of visual representations to make data more understandable and to facilitate insights through interactive and exploratory techniques. Key components of visual analytics include: 1. **Data Visualization**: The graphical representation of data in order to identify patterns, trends, and outliers. Common visualization techniques include charts, graphs, and maps.
VisAD (Visualization for Algorithm Development) is a software system designed for interactive visualization and analysis of scientific data. Developed primarily to support the visualization of multidimensional data, VisAD enables users to create graphical representations of complex datasets, making it easier to analyze and interpret scientific information. Key features of VisAD include: 1. **Multidimensional Data**: It supports various data types and dimensions, allowing scientists to visualize data across multiple variables and time dimensions.
Vis5D is a visualization software application designed for the interactive display and analysis of three-dimensional scientific data, particularly in the fields of meteorology, oceanography, and other earth sciences. It enables users to visualize complex multi-dimensional data sets, such as those generated from simulations, models, and observational data.
UTOPIA is a bioinformatics tool designed for the analysis and visualization of genomic, transcriptomic, and epigenomic data. It is specifically aimed at helping researchers interpret high-throughput sequencing data, such as that generated by next-generation sequencing (NGS) technologies. Key features of UTOPIA may include: 1. **Data Integration**: UTOPIA allows users to integrate various types of biological data, making it easier to correlate genomic information with other datasets like proteomics or metabolomics.
UGENE is a bioinformatics software platform designed for the analysis and visualization of genomic and biological data. It provides a graphical user interface (GUI) that allows users to perform various genomic analyses without needing extensive programming skills. UGENE supports a wide range of functionalities, including: 1. **Sequence Alignment**: Users can perform multiple sequence alignments and visualize the results. 2. **Gene Prediction**: UGENE includes tools for predicting gene structures in genomic sequences.
The timeline of scientific computing highlights the evolution of computation and its applications in scientific research. Below is a summary of key developments in the field: ### 1940s - **1941**: Konrad Zuse completes the Z3, the first programmable digital computer. - **1942**: The Electronic Numerical Integrator and Computer (ENIAC) is completed, marking a significant advance in computing power and speed.
Teramac refers to a variety of technologies and contexts, but it is often associated with a specific line of products or systems related to telecommunications and electronics.
TORQUE can refer to different concepts depending on the context, but here are a couple of the most common usages: 1. **Physics**: In physics, torque is a measure of the rotational force applied to an object around a pivot point or axis. It is often described mathematically as the product of the force applied and the distance from the pivot point to the line of action of the force.
The Starlight Information Visualization System is a software tool designed to help users visualize and analyze complex datasets. It's particularly useful in fields such as bioinformatics, social network analysis, and financial analysis, where large amounts of multidimensional data can be challenging to interpret. Starlight employs various visualization techniques, including graphical representations like graphs, charts, and interactive dashboards, enabling users to observe patterns, relationships, and trends in their data.
The Staden Package is a collection of programs and tools designed for the analysis and manipulation of DNA and protein sequences. It was developed primarily for the purpose of processing and analyzing sequence data obtained from DNA sequencing technologies. The package is named after the city of Staden, where the project originated in the 1980s.
The term "social genome" typically refers to the complex interplay of social factors, behaviors, and characteristics that shape individual and collective social experiences. While it can vary based on context, it often encompasses elements such as social networks, relationships, cultural influences, and the impact of socioeconomic status on behavior and outcomes in society.
The Simulation Open Framework Architecture (SOFA) is an open-source framework designed primarily for the simulation of physical interactions, particularly in the context of real-time simulations. It is particularly well-suited for applications in areas like robotics, virtual reality, and medical simulations.
The Simulated Fluorescence Process (SFP) algorithm is a computational method used primarily in the realm of molecular dynamics and computational chemistry to simulate the behavior of fluorescent molecules and systems that exhibit fluorescence. Although the specifics can vary based on the particular implementation or application, I can summarize the general principles and components of such algorithms. 1. **Background on Fluorescence**: Fluorescence is the emission of light by a substance that has absorbed light or other electromagnetic radiation.
The Sidney Fernbach Award is an honor presented by the IEEE Computer Society's Technical Committee on High-Performance Computing (TCHPC). It recognizes individuals or teams for their outstanding contributions in the field of high-performance computing (HPC) and computational science. The award specifically highlights innovative uses of high-performance computing that lead to significant advancements in various applications, especially those that push the boundaries of computational capabilities.
The Scientific Computing and Imaging (SCI) Institute is a research institute typically associated with academic institutions, focusing on the intersection of scientific computing, imaging, and data analysis. Established at the University of Utah, the SCI Institute conducts research and develops computational methods and visualization techniques to tackle complex scientific and engineering problems. Key areas of focus for the SCI Institute often include: 1. **Scientific Computing**: Developing algorithms and software for numerical simulations and modeling in various scientific disciplines such as physics, biology, and engineering.
The SRM Engine Suite typically refers to a set of software tools designed for Supplier Relationship Management (SRM). These tools help organizations manage their interactions and relationships with suppliers more effectively. Although the exact components and features of an SRM Engine Suite can vary depending on the vendor or provider, here are some common functionalities you might find: 1. **Supplier Evaluation and Selection**: Tools for assessing suppliers based on criteria like performance, quality, cost, and compliance.
Research Computing Services (RCS) refers to a variety of support services and resources provided by institutions—typically universities, research organizations, or governmental entities—to facilitate research activities through advanced computing technologies. These services aim to enhance the efficiency, productivity, and capabilities of researchers by providing access to high-performance computing (HPC), data storage, software applications, and technical support.
"Real RAM" typically refers to the physical random access memory (RAM) installed in a computer or device, as opposed to virtual memory or other forms of memory management. RAM is a type of volatile memory that temporarily stores data that the CPU needs to access quickly while performing tasks. Key characteristics of real RAM include: 1. **Volatility**: RAM is volatile, meaning it loses its content when power is turned off.
Pinned article: Introduction to the OurBigBook Project
Welcome to the OurBigBook Project! Our goal is to create the perfect publishing platform for STEM subjects, and get university-level students to write the best free STEM tutorials ever.
Everyone is welcome to create an account and play with the site: ourbigbook.com/go/register. We belive that students themselves can write amazing tutorials, but teachers are welcome too. You can write about anything you want, it doesn't have to be STEM or even educational. Silly test content is very welcome and you won't be penalized in any way. Just keep it legal!
Intro to OurBigBook
. Source. We have two killer features:
- topics: topics group articles by different users with the same title, e.g. here is the topic for the "Fundamental Theorem of Calculus" ourbigbook.com/go/topic/fundamental-theorem-of-calculusArticles of different users are sorted by upvote within each article page. This feature is a bit like:
- a Wikipedia where each user can have their own version of each article
- a Q&A website like Stack Overflow, where multiple people can give their views on a given topic, and the best ones are sorted by upvote. Except you don't need to wait for someone to ask first, and any topic goes, no matter how narrow or broad
This feature makes it possible for readers to find better explanations of any topic created by other writers. And it allows writers to create an explanation in a place that readers might actually find it.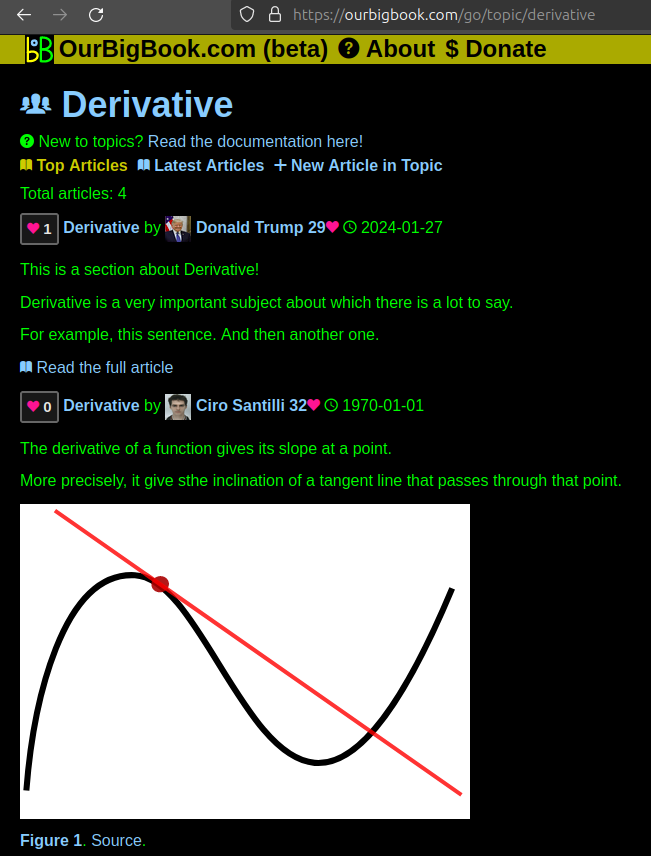
Figure 1. Screenshot of the "Derivative" topic page. View it live at: ourbigbook.com/go/topic/derivativeVideo 2. OurBigBook Web topics demo. Source. - local editing: you can store all your personal knowledge base content locally in a plaintext markup format that can be edited locally and published either:This way you can be sure that even if OurBigBook.com were to go down one day (which we have no plans to do as it is quite cheap to host!), your content will still be perfectly readable as a static site.
- to OurBigBook.com to get awesome multi-user features like topics and likes
- as HTML files to a static website, which you can host yourself for free on many external providers like GitHub Pages, and remain in full control

Figure 2. You can publish local OurBigBook lightweight markup files to either OurBigBook.com or as a static website.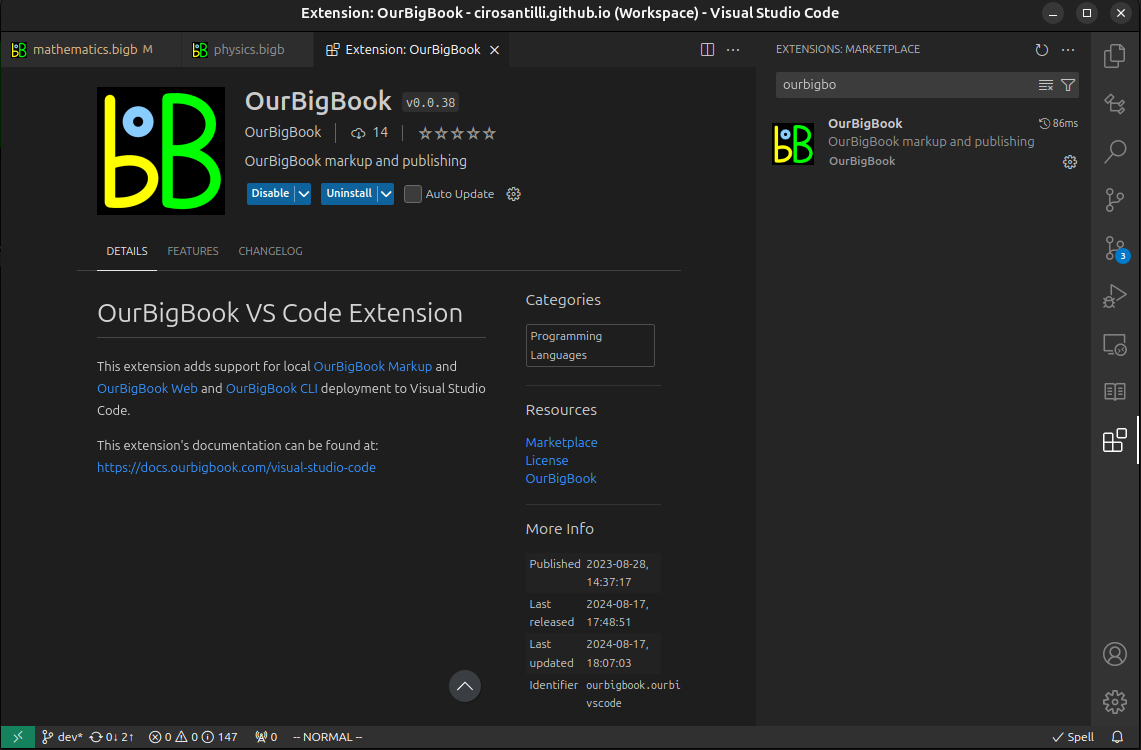
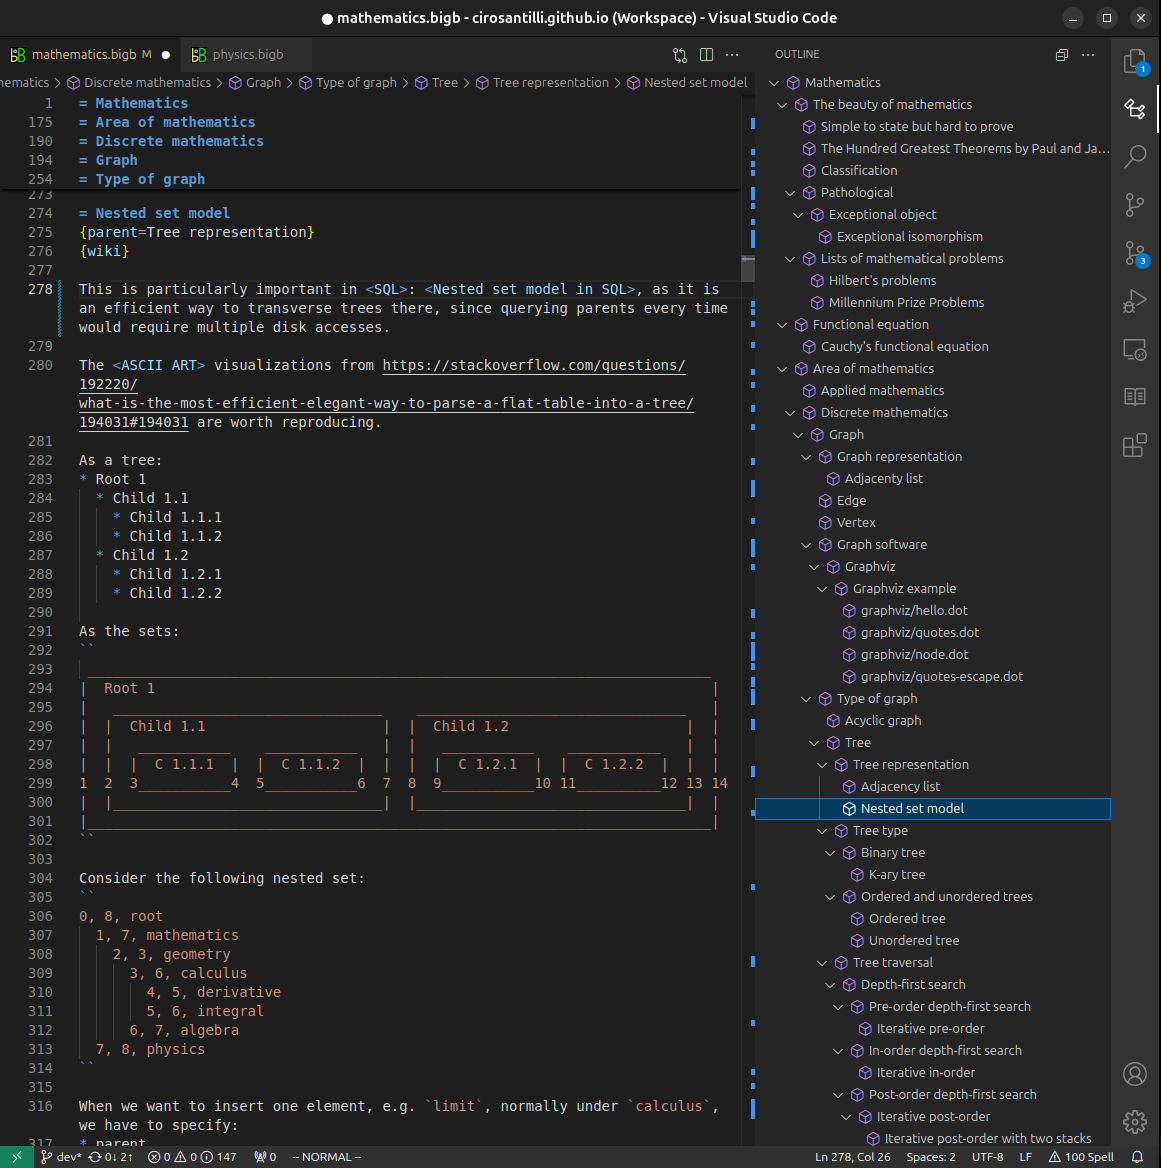
Figure 3. Visual Studio Code extension installation.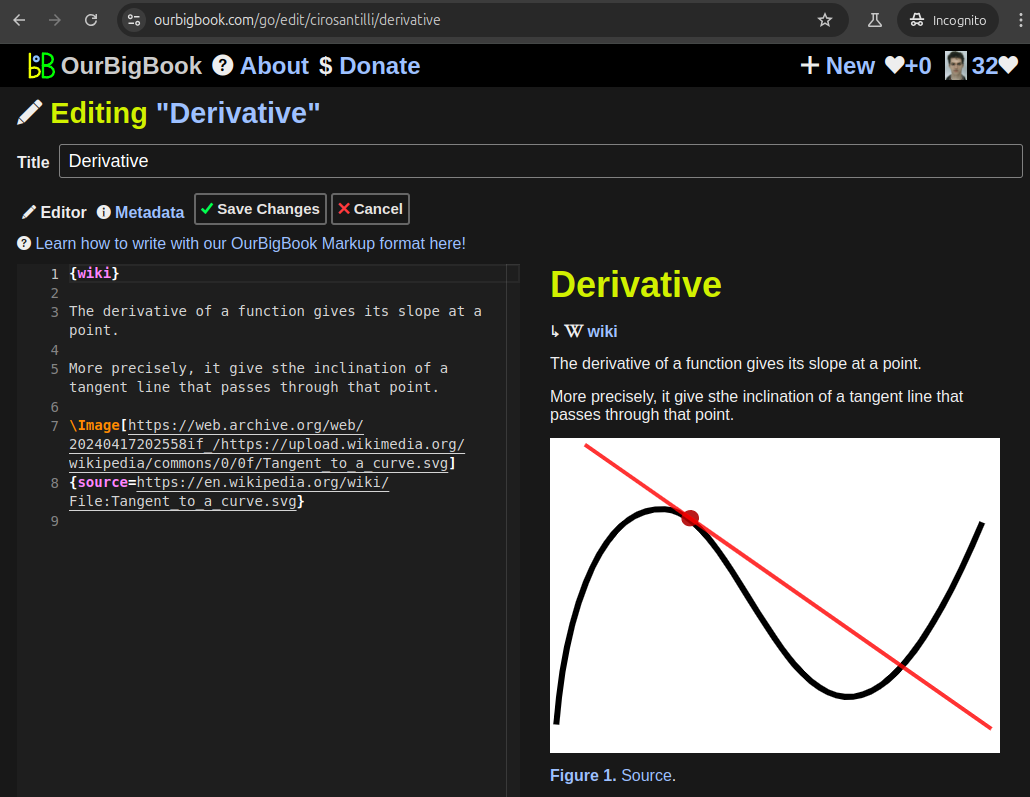
Figure 5. . You can also edit articles on the Web editor without installing anything locally. Video 3. Edit locally and publish demo. Source. This shows editing OurBigBook Markup and publishing it using the Visual Studio Code extension. 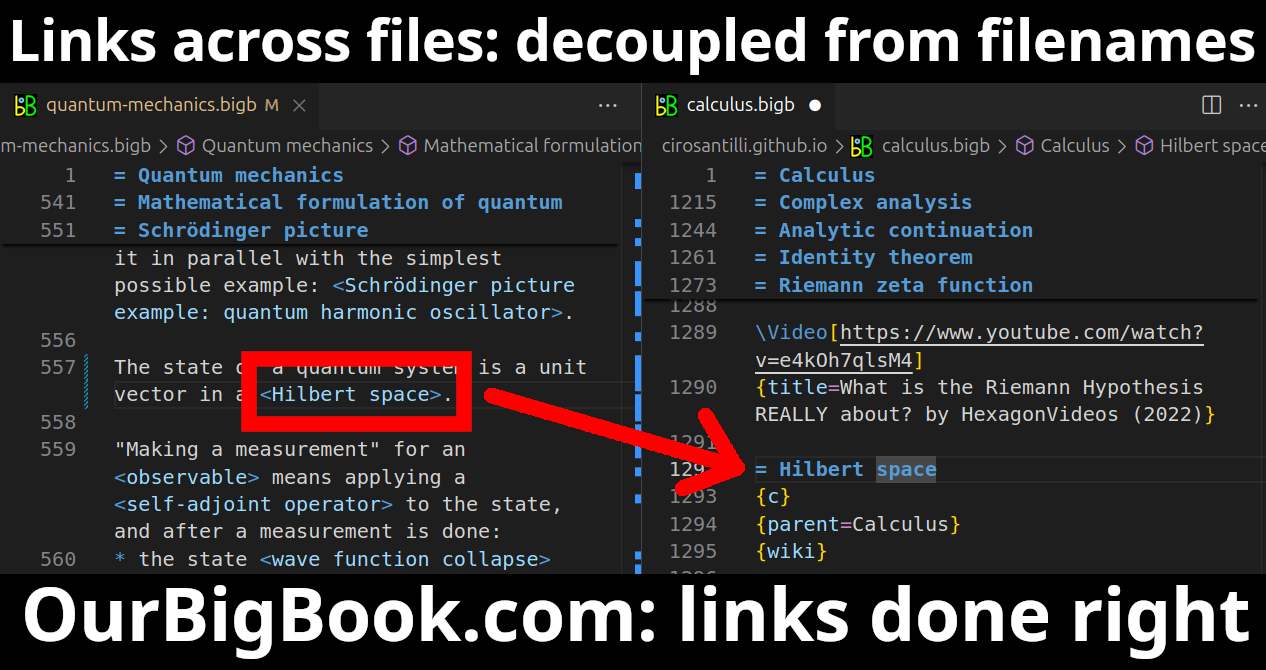
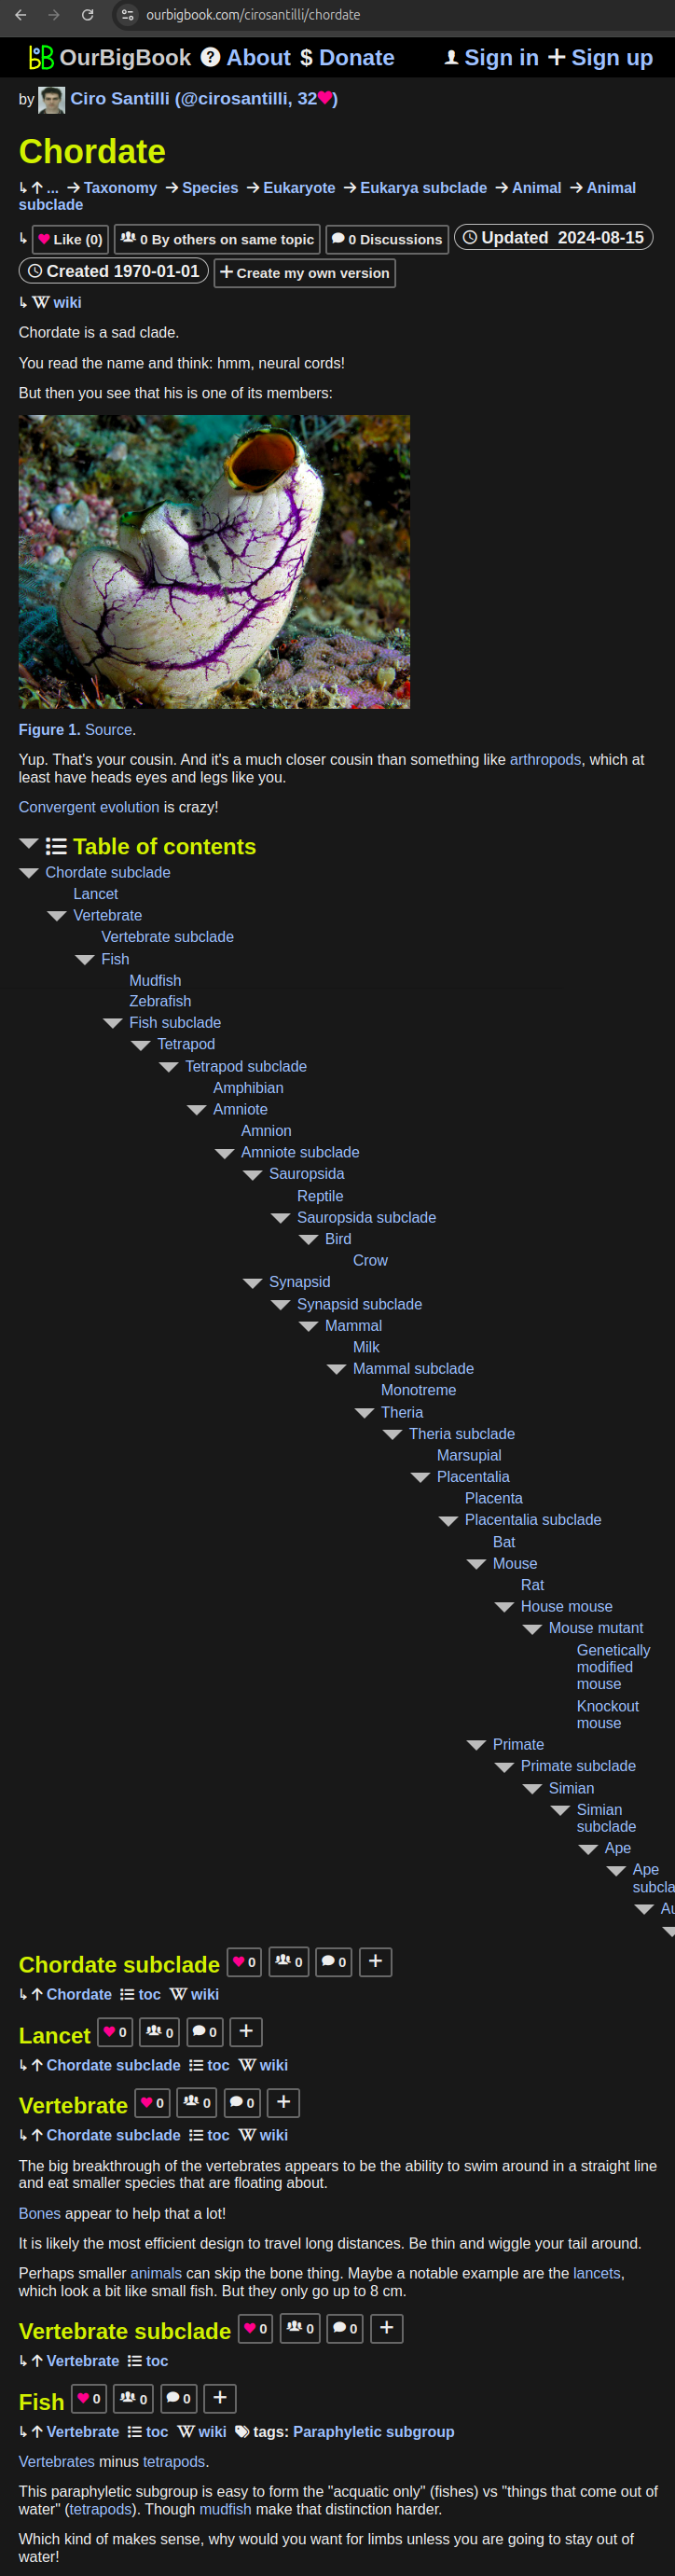
- Infinitely deep tables of contents:
All our software is open source and hosted at: github.com/ourbigbook/ourbigbook
Further documentation can be found at: docs.ourbigbook.com
Feel free to reach our to us for any help or suggestions: docs.ourbigbook.com/#contact