
A histogram groups numerical observations into adjacent intervals called bins and draws one rectangle per bin. Its attraction is that a long list of values becomes a visible pattern of concentration, gaps and skewness. Specify the bin edges, the treatment of values on those edges, and what the vertical axis means: count, proportion, or density. Those choices are part of the graphic. [ref]
https://www.itl.nist.gov/div898/handbook/eda/section3/histogra.htm. NIST/SEMATECH, Histogram, definition and normalization
Let observations be covered by disjoint bins with positive widths and counts , so . For example, use left-closed, right-open bins, closing the final right edge too. The three common height choices have different meanings:
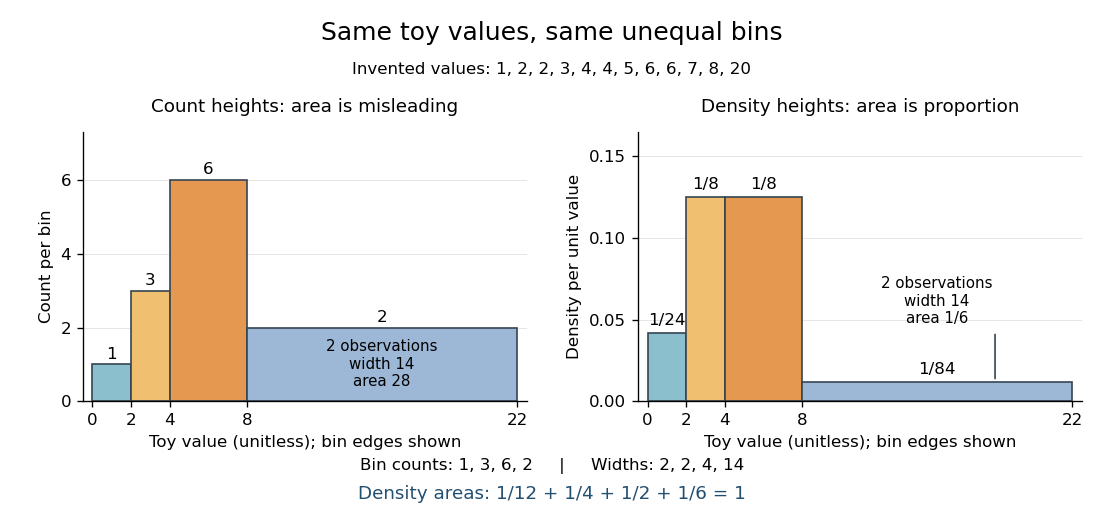
For the density convention, a histogram is a piecewise constant probability density function estimate:Its normalization follows by adding rectangular areas:If the observations have units, density has reciprocal units; a density height is not a probability and can exceed . With equal bin widths, count heights and density heights differ only by a common scale factor. With unequal widths, count-height areas give wider bins extra visual weight unrelated to their counts. Dividing by width removes that distortion. R's histogram documentation explicitly describes area-one normalization for unequal bins. [ref]
https://stat.ethz.ch/R-manual/R-devel/library/graphics/html/hist.html. R graphics documentation, hist, frequency versus density
Reuse the twelve invented values under box plot, with bins . The counts are and the widths are . Hence the density heights and areas are exactlyThe second and third bars have equal density heights even though the third contains twice as many observations: it is also twice as wide. The last bar contains only two observations; its count-height area would be , larger than the six-observation bar's . Its correct density area is only .
Bin choice trades detail against stability. Broad bins merge distinctions: the toy bin hides the empty stretch between and . Narrow bins expose gaps but can make each individual observation dominate a bar. With one-unit bins starting at , the bins each contain two values and appear equally prominent; that apparent pattern depends on grouping the repeated integers together. Moving the bin origin also changes membership without changing the observations. For density estimation, this is a form of the bias-variance tradeoff: averaging over broad bins loses local detail, while narrow bins give more variable density estimates across repeated statistical samples. [ref]
https://www.stat.cmu.edu/~cshalizi/uADA/24/lectures/ch14.pdf. Cosma Rohilla Shalizi, Estimating Distributions and Densities, Section 14.1
A useful practice is to compare a few plausible widths and offsets, keeping common edges when comparing groups. Automatic bin selectors are starting points, rather than guarantees of a unique correct picture. [ref]https://numpy.org/doc/stable/reference/generated/numpy.histogram_bin_edges.html. NumPy documentation, histogram_bin_edges, Notes on bin selectors
A histogram retains only bin membership. Its density estimate spreads each bin's fraction uniformly across that bin, so our last bar assigns density throughout even though the only toy values there are and . It does not recover within-bin positions or observation order, and a visually convincing shape does not establish a population probability distribution. A box plot provides a complementary compact summary of quartiles; neither graphic replaces the original observations.


New to topics? Read the docs here!