Topics (203k) Articles (205k) Users (298) Discussions (237) Comments (383) Files (715) New article

The Tanabe–Sugano diagram is a graphical representation used in the field of coordination chemistry and solid-state chemistry to illustrate the energy levels of electronic states in transition metal complexes. It is particularly useful for understanding the effects of ligand field splitting on the d-orbitals of transition metal ions as they interact with ligands.
TNP-ATP, or 2,3,4-trinitrophenyl-ATP, is a chemical compound that is an analog of adenosine triphosphate (ATP) with a trinitrophenyl (TNP) group attached to the adenine portion of the molecule. TNP-ATP is often used in biochemical research as a fluorescent probe to study ATP-binding proteins and to investigate ATP-mediated processes in biological systems.
Surface Plasmon Resonance (SPR) is an optical technique used to measure the binding interactions between biomolecules in real time and without the need for labeling. It exploits the unique properties of surface plasmons, which are coherent oscillations of free electrons at the surface of a conductor, typically at the interface between a metal (usually gold or silver) and a dielectric medium (often water or air).
Surface differential reflectivity (often abbreviated as ZDR) is a radar measurement used primarily in meteorology to characterize precipitation and its properties. It is derived from the difference in the reflectivity of horizontally and vertically polarized radar waves. This measurement helps distinguish between different types of hydrometeors, such as rain, snow, hail, and even the presence of non-meteorological targets (like birds or insects).
Surface core level shift (SCLS) refers to the phenomenon observed in surface-sensitive spectroscopic techniques, such as X-ray photoelectron spectroscopy (XPS), where the binding energy of core-level electrons in atoms located at or near the surface of a material differs from that of the same atoms in the bulk of the material.
Stereoscopic spectroscopy is a technique that combines principles of spectroscopy with stereoscopic imaging to analyze and visualize the spectral characteristics of samples in three dimensions. This method allows researchers to obtain detailed information about the spatial distribution and chemical composition of materials. In traditional spectroscopy, light is used to study the interaction of different materials with electromagnetic radiation, often providing information about their molecular or atomic structure.
Stationary-wave Integrated Fourier-transform Spectrometry (SWIFT) is a sophisticated spectroscopic technique developed to analyze the spectral properties of light, particularly in measuring absorption and emission spectra. This method combines principles of both stationary wave phenomena and Fourier-transform techniques to enhance the sensitivity and resolution of spectral measurements. ### Key Concepts: 1. **Stationary Waves**: In the context of optics, stationary waves refer to wave patterns that remain fixed in space due to the interference of two waves traveling in opposite directions.
Stark spectroscopy is a technique used to investigate the interactions between electric fields and atomic or molecular systems. It relies on the Stark effect, which describes the phenomenon where an external electric field causes a shift and splitting of energy levels in atoms or molecules. This effect is named after Johannes Stark, who discovered it in 1913. In Stark spectroscopy, an external electric field is applied while measuring the absorption or emission spectra of a sample.
The Stark effect is the phenomenon in which the energy levels of atoms and molecules are shifted and split in the presence of an external electric field. This effect is named after the German physicist Johann Stark, who discovered it in 1913. When an external electric field is applied, it interacts with the electric dipole moments of the atoms or molecules.
Spectroscopic notation is a way to represent the electronic configuration of atoms and ions in a concise manner, using specific symbols to denote the energy levels, subshells, and the number of electrons in each subshell. It is particularly useful for describing the quantum states of electrons in atoms, which is essential for understanding chemical behavior and spectral lines.
A spectroradiometer is an analytical instrument used to measure the intensity of light at different wavelengths across the electromagnetic spectrum. It combines the functions of a spectrometer and a radiometer, allowing for the characterization of both the spectral and radiant properties of light sources.
Spectrophotometry is an analytical method used to measure the intensity of light absorbed by a sample at specific wavelengths. This technique is based on the principle that substances absorb light at characteristic wavelengths, and the amount of light absorbed can be related to the concentration of the substance in the sample according to Beer-Lambert's Law. ### Key Concepts: 1. **Light Absorption**: When light passes through a sample, certain wavelengths are absorbed while others may be transmitted or reflected.
A spectrohelioscope is a specialized astronomical instrument used to observe the Sun in different wavelengths of light, allowing scientists to study its surface and atmospheric phenomena in detail. The term itself combines "spectrum" (referring to the range of wavelengths of light) and "helioscope" (a device for observing the Sun). Spectrohelioscopes work by dispersing light from the Sun to separate it into its constituent colors, or spectra.
Spectroelectrochemistry is an interdisciplinary field that combines electrochemistry and spectroscopy to study the properties and behaviors of chemical species at electrochemical interfaces. It involves the simultaneous application of electrochemical techniques and spectroscopic methods to obtain detailed information about the electronic, molecular, and ionic states of species involved in redox processes.
Spectrochemistry is a branch of chemistry that studies the interaction between matter and electromagnetic radiation. It involves the use of various spectroscopic techniques to analyze the composition, structure, and properties of substances based on their absorption, emission, or scattering of light.
A **spectral signature** refers to the unique pattern of reflectance or emittance of electromagnetic radiation (light) from an object or material across different wavelengths of the electromagnetic spectrum. Each material has a distinct spectral signature that can be used to identify and differentiate it from other materials. ### Key Points about Spectral Signatures: 1. **Electromagnetic Spectrum**: Spectral signatures are typically measured across various wavelengths, which may include ultraviolet, visible light, infrared, and microwave ranges.
Spectral resolution refers to the ability of an instrument to distinguish between different wavelengths or frequencies of electromagnetic radiation. It is a critical parameter in various fields, including spectroscopy, astronomy, and remote sensing, as it determines how finely a spectrum can be resolved. Spectral resolution is commonly defined in terms of the wavelength (or frequency) at which a spectrum can be divided into distinct components.
Spectral purity refers to the quality and fidelity of a signal's frequency components, particularly in the context of audio, telecommunications, and radio frequency technologies. It expresses how closely the spectral content of a signal resembles that of an ideal or pure signal, often associated with the desired frequency being transmitted or processed.
A spectral line shape refers to the profile or distribution of intensity (or another measurable quantity) of light or other electromagnetic radiation as a function of frequency (or wavelength) around a specific transition frequency associated with an atomic or molecular transition. The shape of the spectral line can provide significant information about the physical conditions surrounding the emitting or absorbing species, as well as the processes that produce the radiation.
Spectral line ratios refer to the comparison of the strengths (or intensities) of different spectral lines that emerge from a source, often as a result of atomic or molecular transitions. These ratios provide valuable information about the physical conditions in the emitting region, such as temperature, density, chemical composition, and excitation mechanisms.
Pinned article: Introduction to the OurBigBook Project
Welcome to the OurBigBook Project! Our goal is to create the perfect publishing platform for STEM subjects, and get university-level students to write the best free STEM tutorials ever.
Everyone is welcome to create an account and play with the site: ourbigbook.com/go/register. We belive that students themselves can write amazing tutorials, but teachers are welcome too. You can write about anything you want, it doesn't have to be STEM or even educational. Silly test content is very welcome and you won't be penalized in any way. Just keep it legal!
Intro to OurBigBook
. Source. We have two killer features:
- topics: topics group articles by different users with the same title, e.g. here is the topic for the "Fundamental Theorem of Calculus" ourbigbook.com/go/topic/fundamental-theorem-of-calculusArticles of different users are sorted by upvote within each article page. This feature is a bit like:
- a Wikipedia where each user can have their own version of each article
- a Q&A website like Stack Overflow, where multiple people can give their views on a given topic, and the best ones are sorted by upvote. Except you don't need to wait for someone to ask first, and any topic goes, no matter how narrow or broad
This feature makes it possible for readers to find better explanations of any topic created by other writers. And it allows writers to create an explanation in a place that readers might actually find it.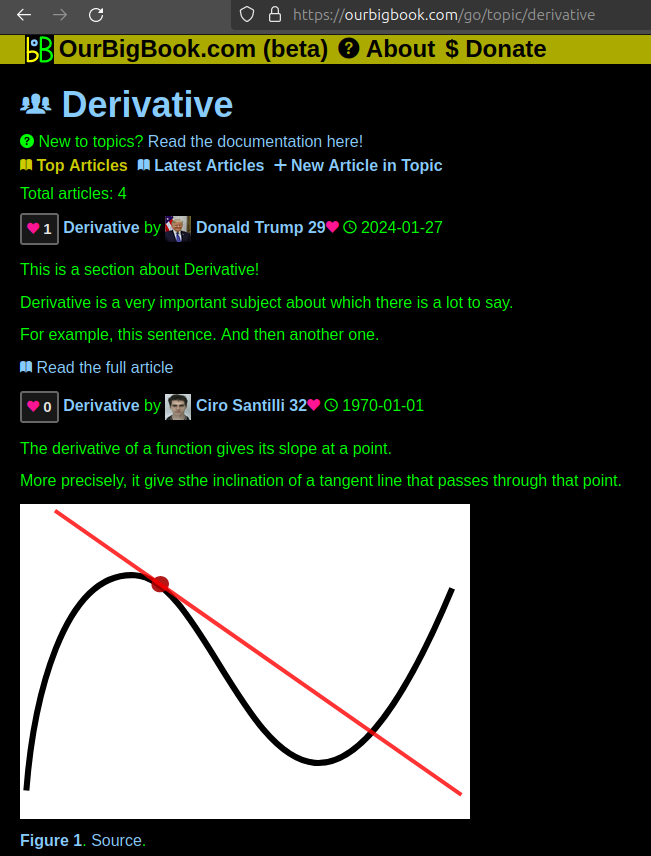
Figure 1. Screenshot of the "Derivative" topic page. View it live at: ourbigbook.com/go/topic/derivativeVideo 2. OurBigBook Web topics demo. Source. - local editing: you can store all your personal knowledge base content locally in a plaintext markup format that can be edited locally and published either:This way you can be sure that even if OurBigBook.com were to go down one day (which we have no plans to do as it is quite cheap to host!), your content will still be perfectly readable as a static site.
- to OurBigBook.com to get awesome multi-user features like topics and likes
- as HTML files to a static website, which you can host yourself for free on many external providers like GitHub Pages, and remain in full control

Figure 2. You can publish local OurBigBook lightweight markup files to either OurBigBook.com or as a static website.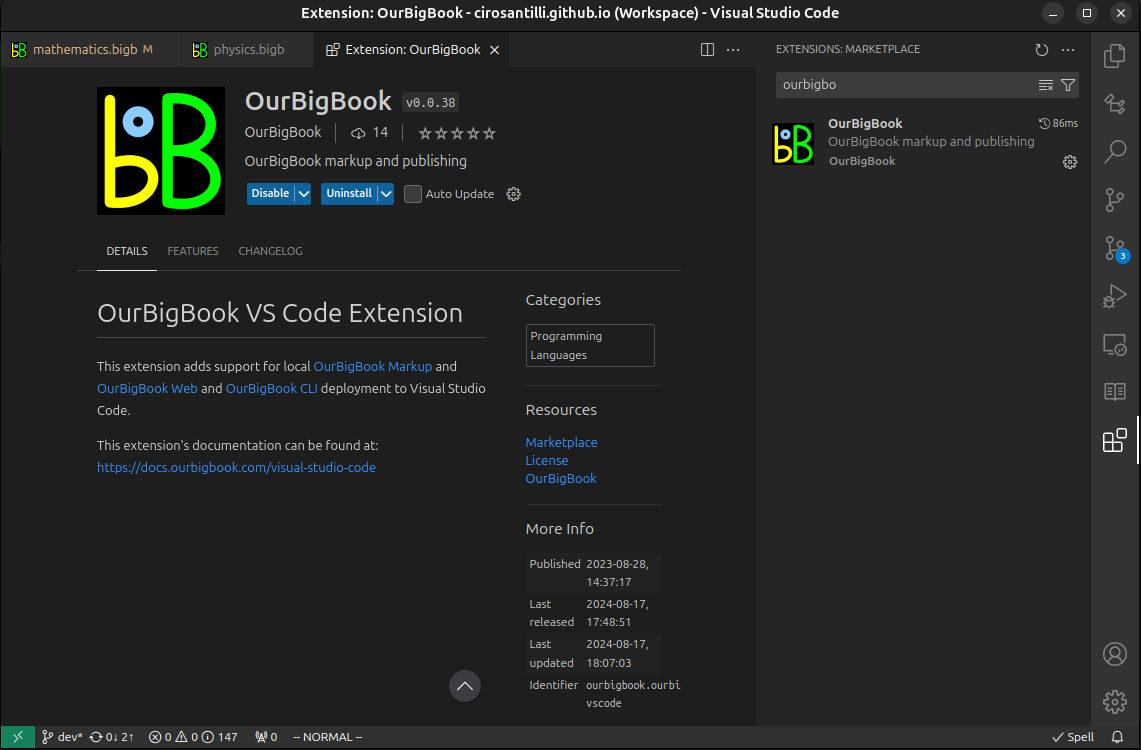
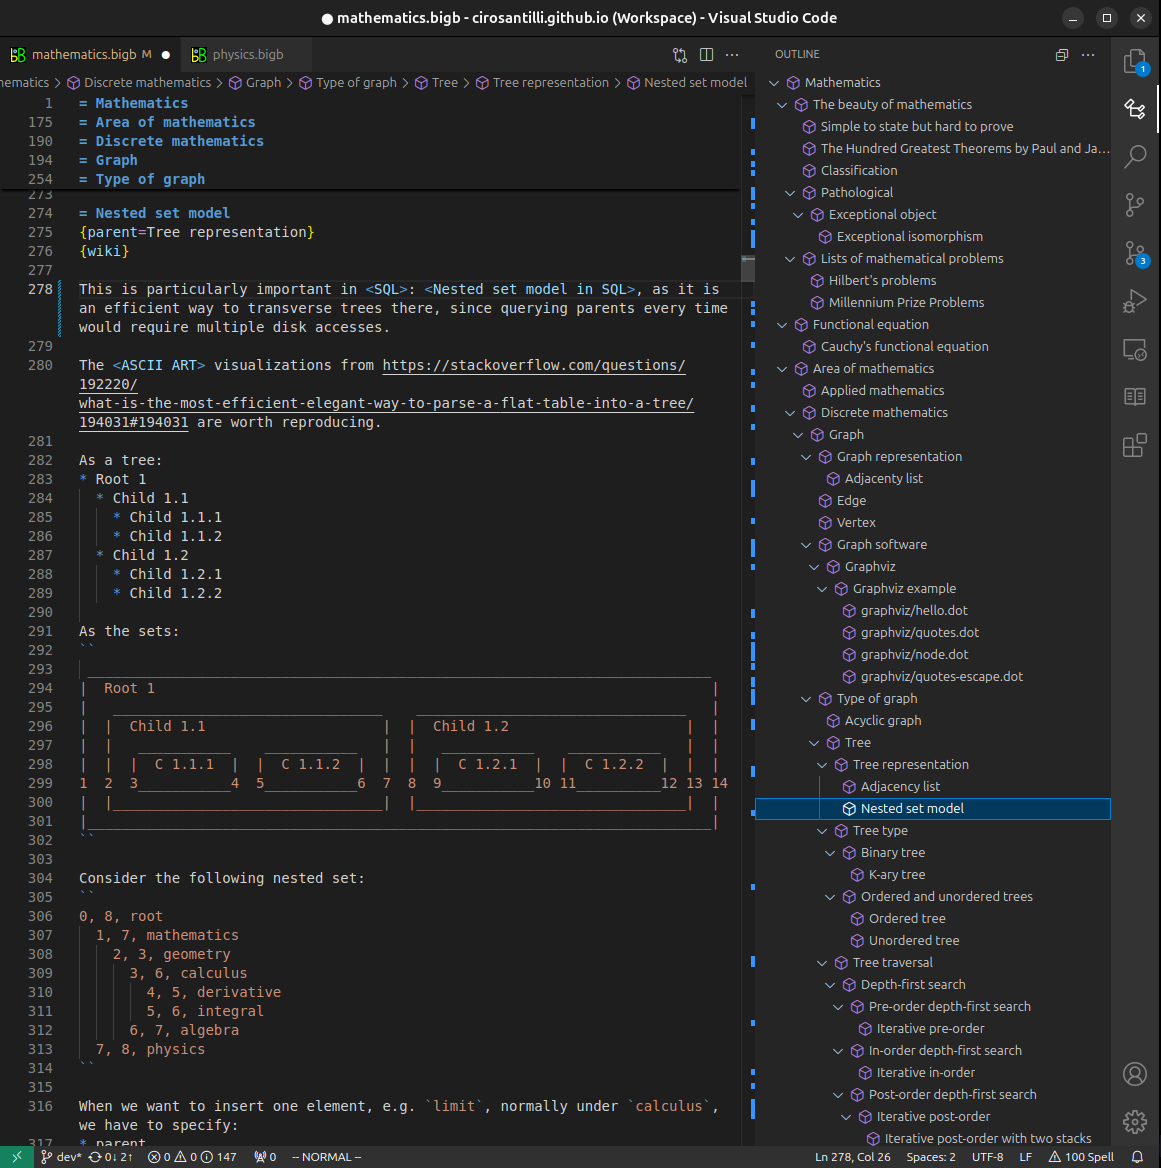
Figure 3. Visual Studio Code extension installation.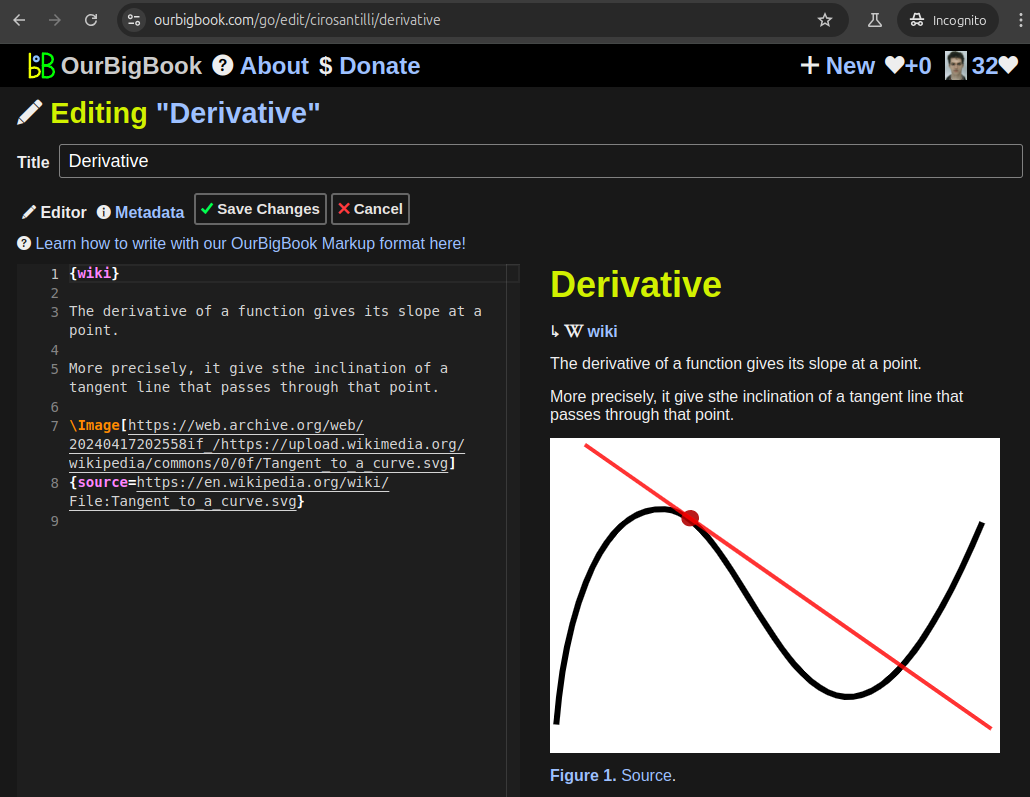
Figure 5. . You can also edit articles on the Web editor without installing anything locally. Video 3. Edit locally and publish demo. Source. This shows editing OurBigBook Markup and publishing it using the Visual Studio Code extension. 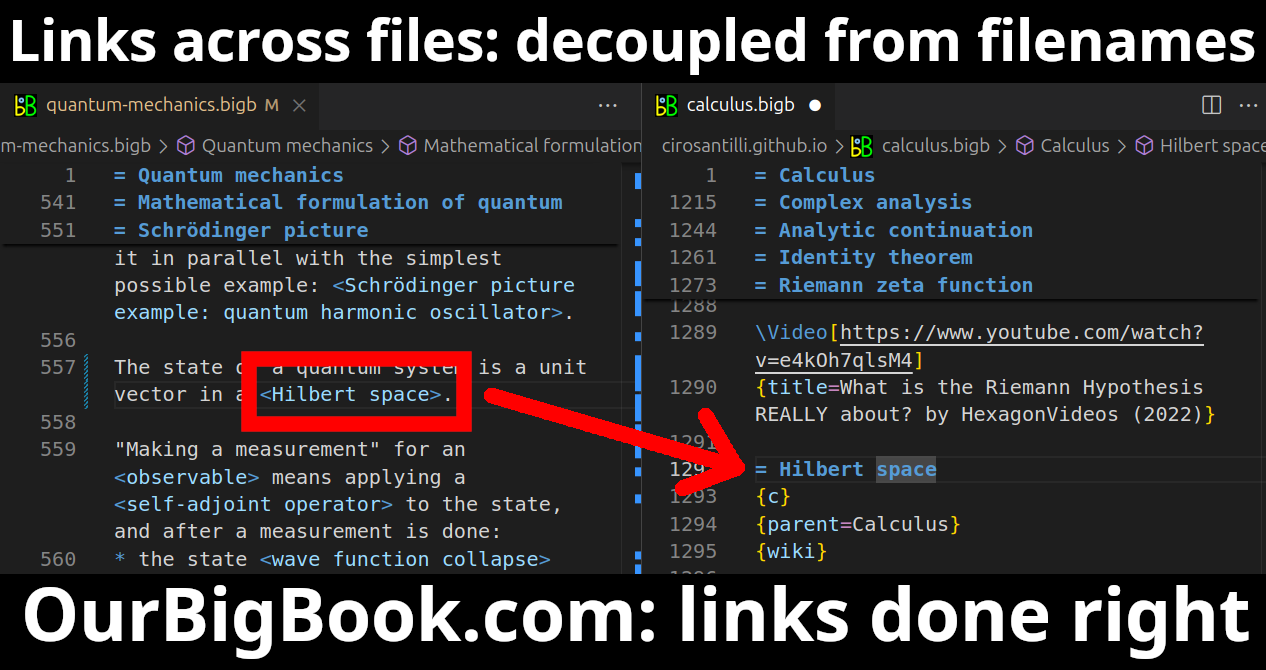
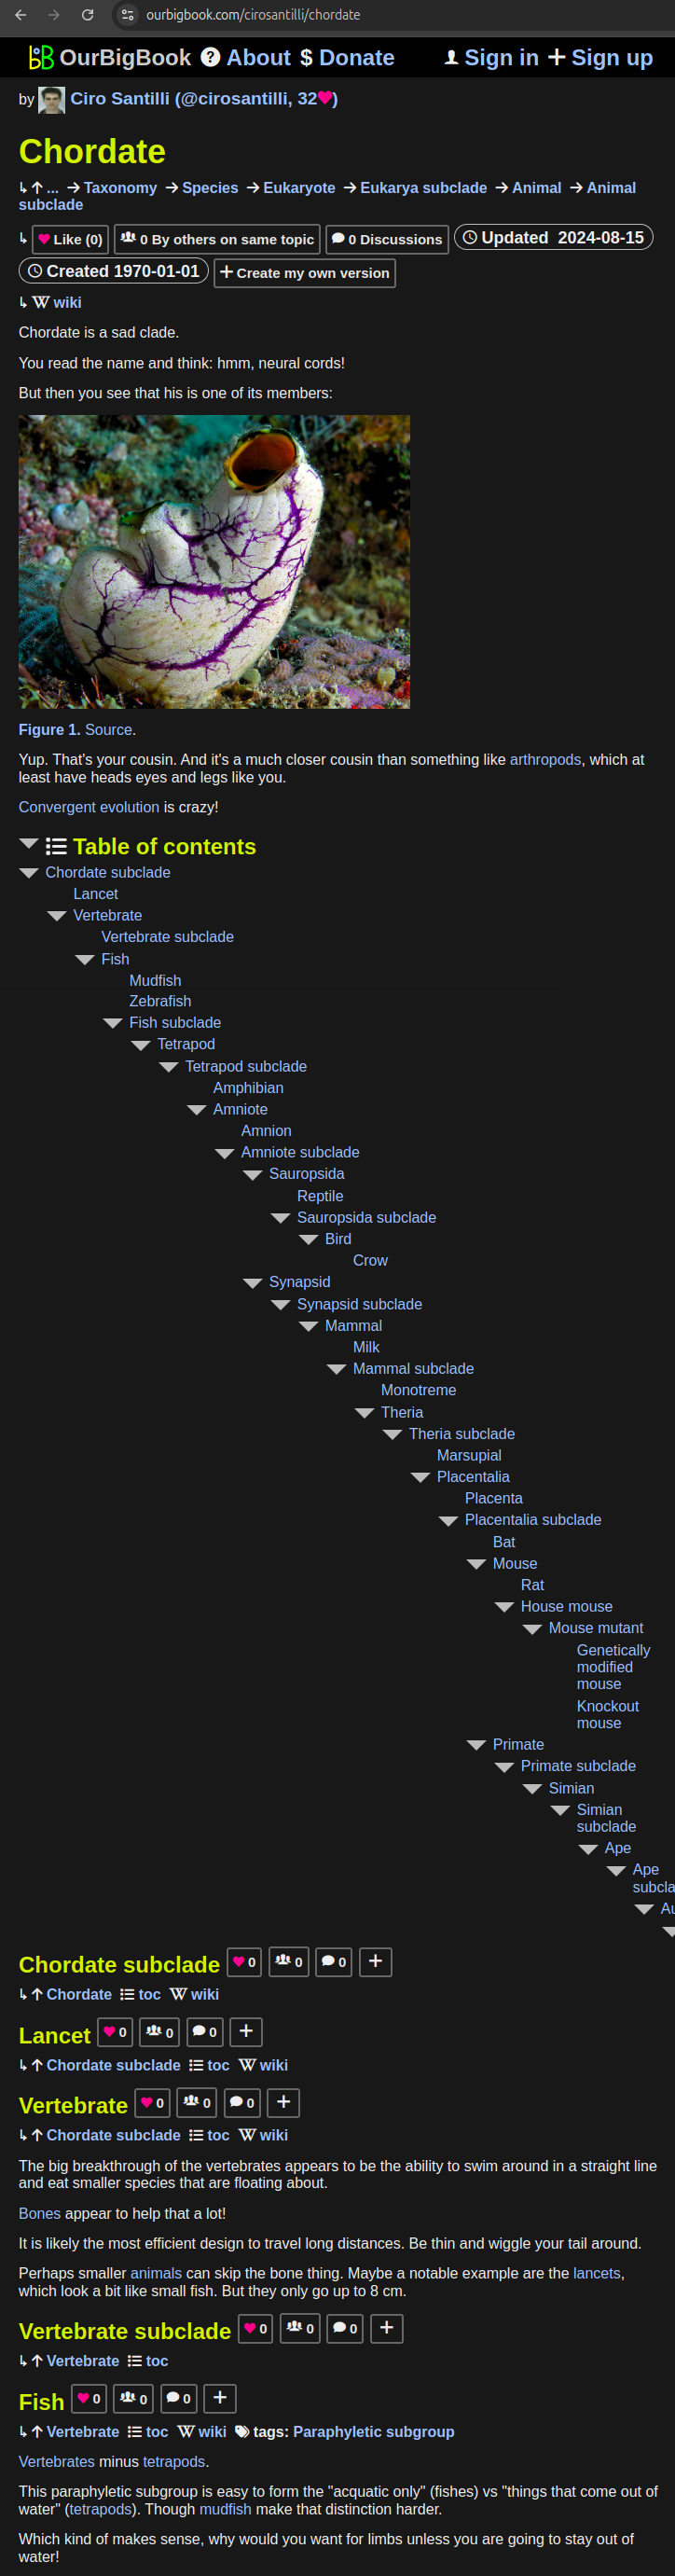
- Infinitely deep tables of contents:
All our software is open source and hosted at: github.com/ourbigbook/ourbigbook
Further documentation can be found at: docs.ourbigbook.com
Feel free to reach our to us for any help or suggestions: docs.ourbigbook.com/#contact