Topics (203k) Articles (205k) Users (305) Discussions (237) Comments (383) Files (715) New article

Cointegration is a statistical property of a collection of time series variables which indicates that, even though the individual series may be non-stationary (i.e., they have a stochastic trend and their statistical properties change over time), there exists a linear combination of those series that is stationary (i.e., its statistical properties do not change over time).
The Cheyette model is a theoretical framework used in the field of economics, particularly in the study of financial markets. It focuses on the dynamics of asset pricing and market behavior in the presence of information asymmetry and behavioral factors. Developed by economist Cheyette, the model incorporates elements of rational expectations and examines how information is disseminated among market participants, influencing their decisions and the overall market equilibrium.
The Carr–Madan formula is a method used in financial mathematics, specifically in the pricing of options and other derivatives. It provides a way to compute the price of an option by using Fourier transform techniques and is particularly useful for options with complex payoff structures. The formula relates the price of a European call or put option to the characteristic function of the underlying asset's log return distribution.
The Black-Scholes equation is a mathematical model used to price options, specifically European-style options. It was introduced by economists Fischer Black and Myron Scholes in their 1973 paper, with significant contributions from Robert Merton. The equation provides a theoretical estimate of the price of European call and put options and is widely used in financial markets. The Black-Scholes equation is based on several assumptions, including: 1. The stock price follows a geometric Brownian motion with constant volatility.
The Binomial Options Pricing Model (BOPM) is a widely used method for valuing options, which are financial derivatives that give the holder the right (but not the obligation) to buy or sell an underlying asset at a specified price before a specified expiration date. The model was introduced by Cox, Ross, and Rubinstein in 1979 and is based on a discrete-time framework.
A bid-ask matrix is a tool used in trading and finance to represent the relationship between the bid prices (the prices buyers are willing to pay) and ask prices (the prices sellers are willing to accept) for a particular asset, such as stocks, currencies, or commodities. This matrix provides a visual way to understand the spread between the bid and ask prices across a range of quantities or orders. ### Components of a Bid-Ask Matrix 1.
In finance, **beta** is a measure of a stock's volatility in relation to the overall market. It is a key component of the Capital Asset Pricing Model (CAPM), which helps determine an investment's expected return based on its risk relative to that of the market. Here’s how beta is interpreted: - **Beta = 1**: The stock's price moves with the market.
Autoregressive Conditional Duration (ACD) is a statistical modeling framework primarily used in the analysis of time series data, particularly in situations where the timing of events is of interest. It is often applied in fields such as finance, econometrics, and survival analysis to model the durations between consecutive events. ### Key Concepts: 1. **Duration**: In this context, duration refers to the time interval between consecutive occurrences of an event.
The Annual Percentage Rate (APR) is a financial term that represents the total cost of borrowing or the return on investment expressed as a yearly interest rate. It includes not just the interest rate on a loan or investment but also any associated fees or additional costs, allowing borrowers or investors to better understand the true cost or yield associated with a financial product.
Alternative beta refers to a type of beta that captures the sensitivity of an investment’s returns to factors other than the traditional market risk factors typically associated with equities. In finance, beta is a measure of a security's volatility in relation to the overall market; a beta greater than 1 indicates higher volatility than the market, while a beta less than 1 indicates lower volatility. Alternative beta, however, is often associated with alternative investment strategies, such as hedge funds or private equity.
Alpha profiling typically refers to a method used in various fields, including finance and trading, to analyze and evaluate the performance of investment strategies, particularly those that aim to generate "alpha." "Alpha" is a measure of an investment's performance on a risk-adjusted basis, representing the excess return that an investment generates compared to a benchmark index.
In finance, "alpha" refers to a measure of an investment's performance on a risk-adjusted basis. Specifically, it represents the excess return of an investment relative to the return of a benchmark index or risk-free rate, taking into account the level of risk associated with that investment. Alpha is often used in the context of portfolio management and hedge funds to evaluate the skill of fund managers.
An Affine Term Structure Model (ATSM) is a class of models used in finance to describe the evolution of interest rates over time. The term structure of interest rates refers to the relationship between interest rates (or bond yields) and different maturities. The term "affine" refers to the mathematical form of the model, where the relationship is linear in parameters, making the analysis and computation more tractable.
An admissible trading strategy refers to a trading approach that meets specific criteria or conditions defined by a given financial model or regulatory framework. The term is commonly used in the context of finance, particularly in relation to optimal portfolio management and risk management. Key characteristics of admissible trading strategies include: 1. **Feasibility**: The strategy must be implementable under the constraints of the market, such as liquidity, transaction costs, and other trading limitations.
Adjusted current yield is a financial metric used to assess the yield of a bond or fixed-income investment, taking into account certain adjustments beyond the standard current yield. The current yield is calculated as the annual coupon payment divided by the current market price of the bond.
The concept of an "accumulation function" can refer to different things depending on the context, but it generally involves a way to compute a cumulative total or a running total of a particular quantity over time. Here are a few contexts where the term might apply: 1. **Mathematics and Finance**: In finance, an accumulation function often refers to a function that describes how the value of an investment grows over time due to interest or returns.
AZFinText is a dataset that is specifically designed for the analysis of financial texts. It includes a large collection of financial documents, such as news articles, earnings reports, and SEC filings, annotated with various financial concepts. The primary purpose of AZFinText is to support research and development in financial natural language processing (NLP) tasks, including sentiment analysis, information extraction, and named entity recognition in the financial domain.
Short-rate models are a class of mathematical models used in finance to describe the evolution of interest rates over time. In these models, the short rate, which is the interest rate for a very short period (often taken to be instantaneous), serves as the key variable. The models often aim to capture the dynamics of interest rates to assist in pricing fixed income securities, managing interest rate risk, and understanding the term structure of interest rates.
Monte Carlo methods are a class of computational algorithms that rely on repeated random sampling to obtain numerical results. In finance, these methods are widely used for various purposes, including: 1. **Option Pricing**: Monte Carlo simulations can be used to estimate the value of complex financial derivatives, such as options, especially when there are multiple sources of uncertainty (e.g., multiple underlying assets, exotic options).
Investment indicators are metrics or signals that assist investors in evaluating the potential of a particular investment or market. These indicators can be utilized to gauge economic conditions, market trends, and individual asset performance. Here are some common types of investment indicators: 1. **Economic Indicators**: Metrics that signal the overall health of an economy. Examples include Gross Domestic Product (GDP), unemployment rates, inflation rates, and consumer confidence indices.
Pinned article: Introduction to the OurBigBook Project
Welcome to the OurBigBook Project! Our goal is to create the perfect publishing platform for STEM subjects, and get university-level students to write the best free STEM tutorials ever.
Everyone is welcome to create an account and play with the site: ourbigbook.com/go/register. We belive that students themselves can write amazing tutorials, but teachers are welcome too. You can write about anything you want, it doesn't have to be STEM or even educational. Silly test content is very welcome and you won't be penalized in any way. Just keep it legal!
Intro to OurBigBook
. Source. We have two killer features:
- topics: topics group articles by different users with the same title, e.g. here is the topic for the "Fundamental Theorem of Calculus" ourbigbook.com/go/topic/fundamental-theorem-of-calculusArticles of different users are sorted by upvote within each article page. This feature is a bit like:
- a Wikipedia where each user can have their own version of each article
- a Q&A website like Stack Overflow, where multiple people can give their views on a given topic, and the best ones are sorted by upvote. Except you don't need to wait for someone to ask first, and any topic goes, no matter how narrow or broad
This feature makes it possible for readers to find better explanations of any topic created by other writers. And it allows writers to create an explanation in a place that readers might actually find it.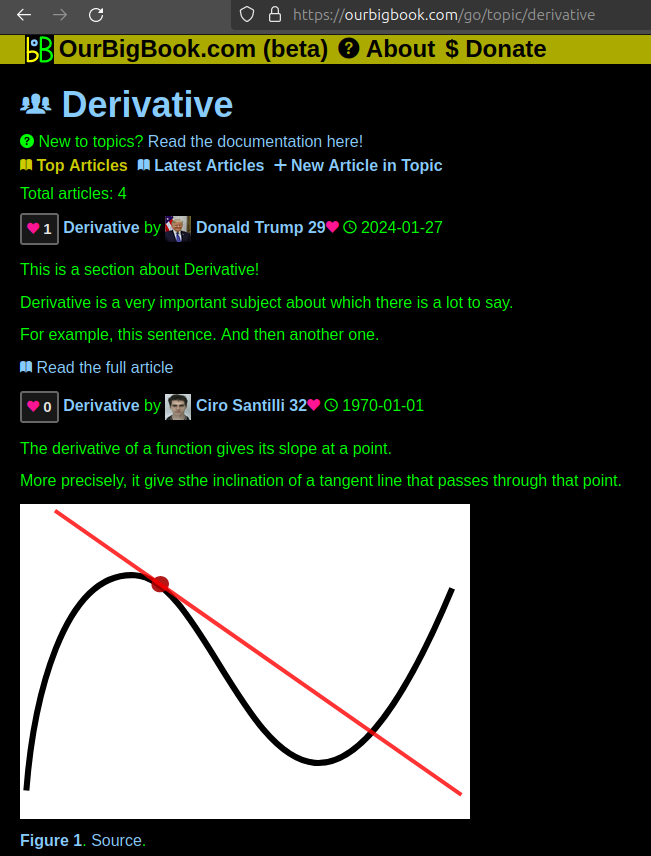
Figure 1. Screenshot of the "Derivative" topic page. View it live at: ourbigbook.com/go/topic/derivativeVideo 2. OurBigBook Web topics demo. Source. - local editing: you can store all your personal knowledge base content locally in a plaintext markup format that can be edited locally and published either:This way you can be sure that even if OurBigBook.com were to go down one day (which we have no plans to do as it is quite cheap to host!), your content will still be perfectly readable as a static site.
- to OurBigBook.com to get awesome multi-user features like topics and likes
- as HTML files to a static website, which you can host yourself for free on many external providers like GitHub Pages, and remain in full control
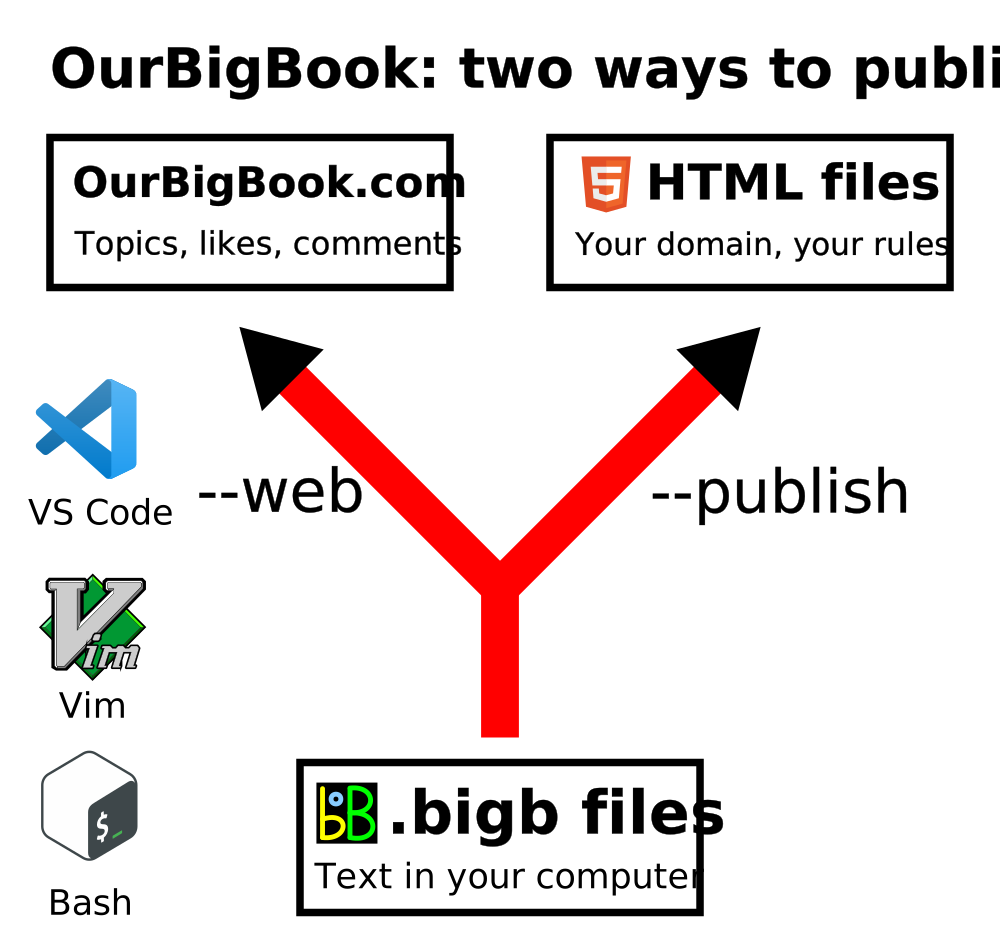
Figure 2. You can publish local OurBigBook lightweight markup files to either OurBigBook.com or as a static website.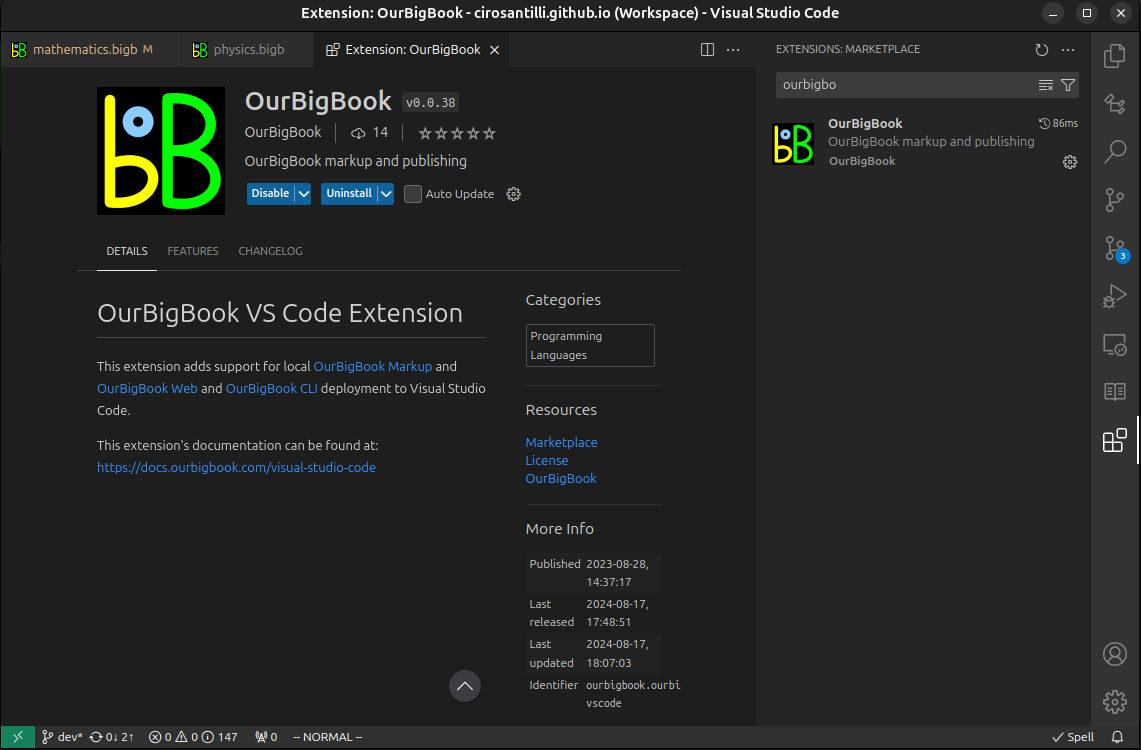
Figure 3. Visual Studio Code extension installation.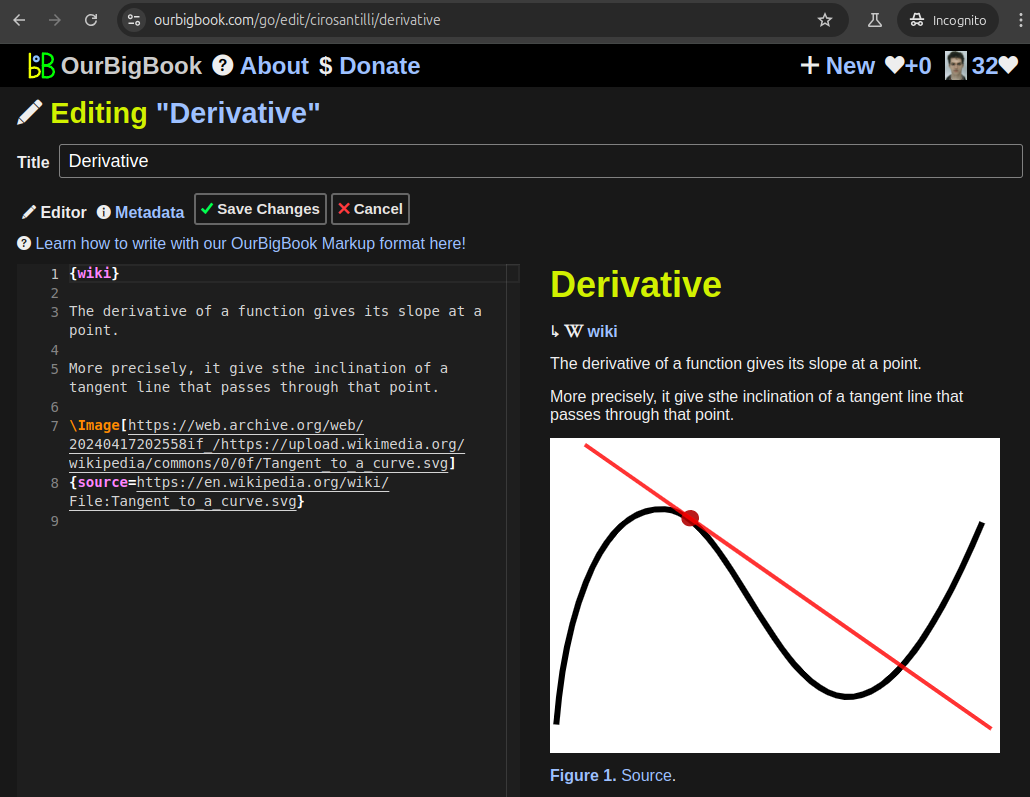
Figure 5. . You can also edit articles on the Web editor without installing anything locally. Video 3. Edit locally and publish demo. Source. This shows editing OurBigBook Markup and publishing it using the Visual Studio Code extension. 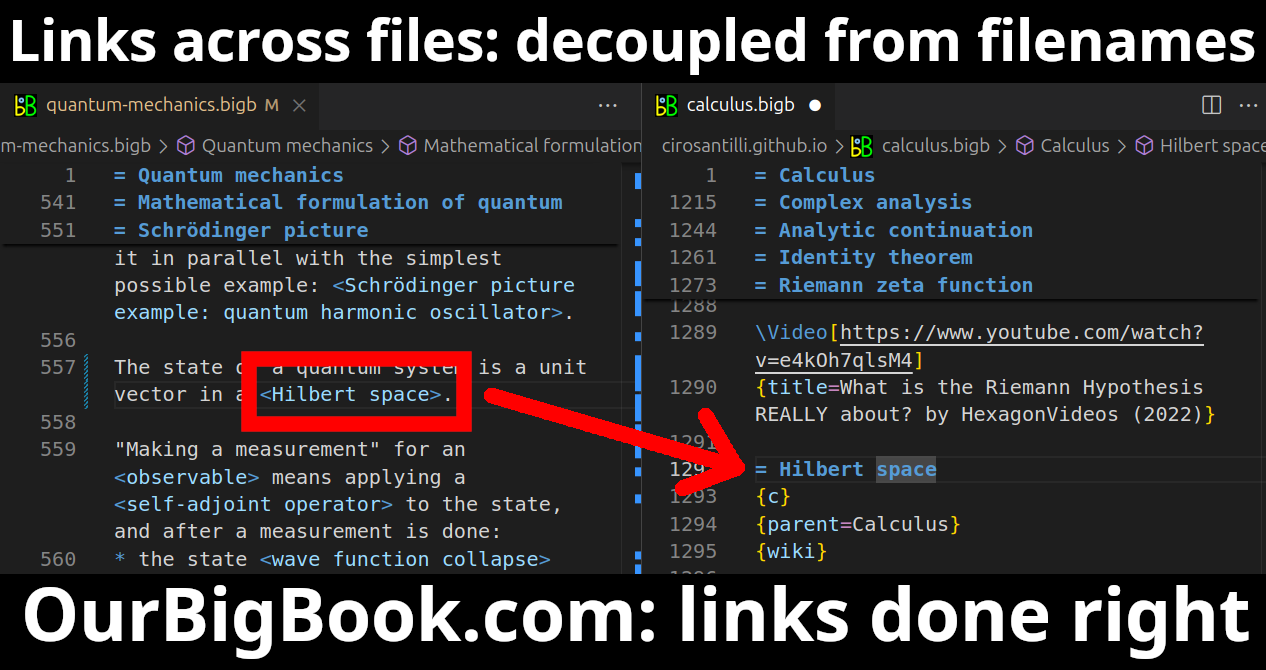
- Infinitely deep tables of contents:
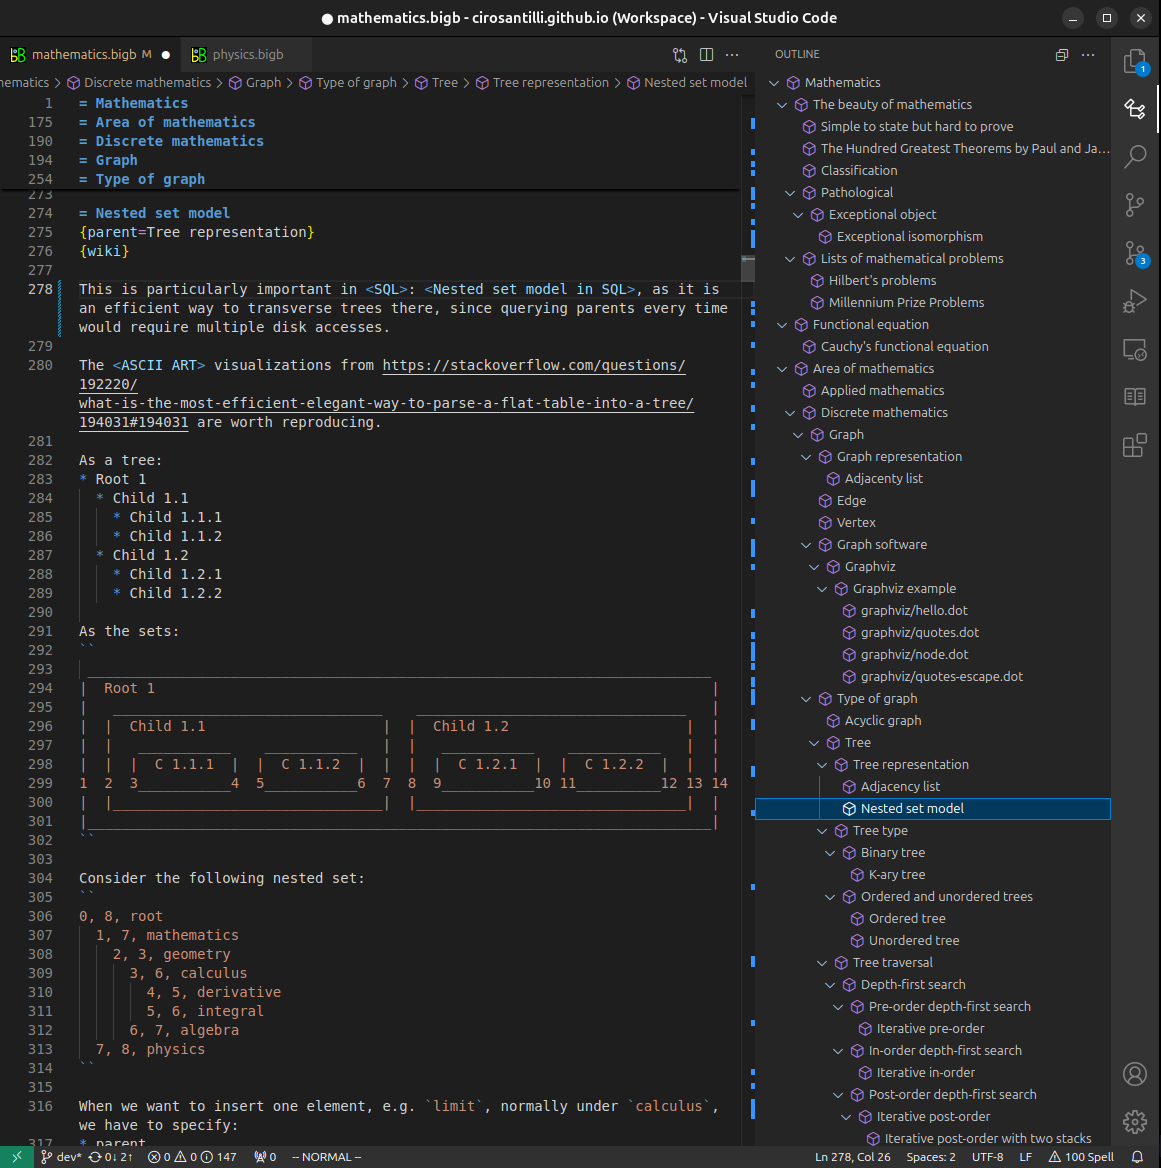

All our software is open source and hosted at: github.com/ourbigbook/ourbigbook
Further documentation can be found at: docs.ourbigbook.com
Feel free to reach our to us for any help or suggestions: docs.ourbigbook.com/#contact