Topics (203k) Articles (205k) Users (299) Discussions (237) Comments (383) Files (715) New article

Civic statistics refer to data and metrics that pertain to the governance, public policies, and civic engagement of a community or population. This term can encompass various aspects of civic life, including: 1. **Demographics**: Information about the population within a certain area, including age, race, gender, income levels, education, and employment statistics. 2. **Voter Participation**: Data regarding voter turnout in elections, registration rates, and demographics of voters.
Cheminformatics, also known as chemical informatics or computational chemistry, is a field that combines chemistry, computer science, and information technology to study chemical data and facilitate chemical research. It involves the use of software tools and computational methods to collect, analyze, visualize, and manage chemical information. Key aspects of cheminformatics include: 1. **Data Representation**: Creating digital representations of chemical compounds, typically through the use of molecular structures, descriptors, and fingerprints.
Burstiness refers to the phenomenon where events occur in bursts or clusters rather than being evenly distributed over time. In various contexts, such as network traffic, biological processes, and linguistic patterns, burstiness describes how certain activities or occurrences tend to happen in sudden waves followed by lulls.
Astrostatistics is an interdisciplinary field that combines techniques from statistics with astronomical data analysis. It aims to develop statistical methodologies and tools specifically tailored to the unique challenges and requirements of analyzing data in astronomy and astrophysics. Given the vast and complex datasets generated by modern astronomical surveys, missions, and experiments, astrostatistics plays a crucial role in interpreting these data accurately.
Astroinformatics is an interdisciplinary field that combines astronomy, computer science, and data science to analyze and interpret large astronomical datasets. As modern astronomy generates vast amounts of data through various instruments, telescopes, and surveys, astroinformatics provides the tools and methodologies for managing, processing, and extracting meaningful information from this data. Key components of astroinformatics include: 1. **Data Management**: Organizing and storing astronomical data in a way that facilitates easy access and analysis.
Statistical Natural Language Processing (Statistical NLP) is a subfield of natural language processing (NLP) that employs statistical methods and techniques to analyze and understand human language. Unlike rule-based approaches that rely on hand-crafted linguistic rules, Statistical NLP uses probabilistic models and machine learning algorithms to derive patterns and infer meaning from large corpora of text data. ### Key Components of Statistical NLP: 1. **Probabilistic Models**: These models are used to predict the likelihood of various linguistic phenomena.
Statistical genetics is a field that combines principles of statistics, genetics, and biology to analyze and interpret genetic data. It involves the development and application of statistical methods to understand the genetic basis of traits and diseases, as well as the inheritance patterns of genes. Key areas of focus in statistical genetics include: 1. **Genetic Mapping**: Identifying the locations of genes associated with specific traits or diseases in the genome, often using techniques like genome-wide association studies (GWAS).
Social statistics is a branch of statistics that focuses on the collection, analysis, interpretation, and presentation of quantitative data related to social phenomena. It involves the use of statistical methods to understand and describe social patterns, relationships, and trends within populations. Social statistics is commonly applied in various fields, including sociology, psychology, economics, education, and public health, among others.
Metrics are quantitative measures used to evaluate, compare, and track performance or progress in various domains. They serve as a standard of measurement that can help organizations and individuals assess effectiveness, efficiency, and the achievement of goals. Metrics are widely used in fields such as business, finance, marketing, health care, software development, and many others. ### Key Characteristics of Metrics: 1. **Quantitative**: Metrics are often expressed in numerical terms, making them easily measurable and comparable.
Geostatistics is a branch of statistics that focuses on spatial data analysis and the modeling of spatially correlated random variables. It is particularly useful in fields such as geology, meteorology, environmental science, mining, and agriculture, where the spatial location of data points plays a critical role in understanding and predicting phenomena.
Engineering statistics is a branch of statistics that focuses on the application of statistical methods and techniques to engineering problems and processes. It involves the collection, analysis, interpretation, and presentation of data related to engineering applications. The main objectives of engineering statistics include improving the quality and performance of engineering systems, processes, and products, as well as supporting decision-making based on data-driven insights.
Econometrics is a branch of economics that applies statistical and mathematical methods to analyze economic data and test economic theories. It aims to give empirical content to economic relationships, allowing economists to quantify and understand the complexities of economic phenomena. The primary tasks of econometrics include: 1. **Model Specification**: Developing economic models that represent relationships between different economic variables, such as consumption and income, or price and demand.
The **survival function**, often denoted as \( S(t) \), is a fundamental concept in survival analysis and statistics, particularly in the context of time-to-event data. It describes the probability that a subject or an individual survives beyond a certain time \( t \).
Stress wave communication refers to a method of transmitting information using mechanical stress waves as the medium. This concept can be applied in various contexts, including engineering, telecommunications, and even biological systems. In its more common applications, stress wave communication leverages vibrations or acoustic waves generated by mechanical stress in materials. Information can be encoded into these waves through variations in frequency, amplitude, or phase, similar to how other communication systems might modulate electromagnetic signals.
Statistical risk refers to the potential for loss or negative outcomes associated with uncertain events and is often quantified using statistical methods. It is a measure of the likelihood and impact of adverse events occurring within a given context, such as finance, insurance, health, or decision-making processes. In practical terms, statistical risk can be defined in several ways, including: 1. **Probability of Adverse Events**: It often involves calculating the probability of specific negative outcomes.
Statistical inference is a branch of statistics that focuses on drawing conclusions about a population based on data collected from a sample. It involves using sample data to make generalizations or predictions about a larger group, while also quantifying the uncertainty associated with these conclusions. There are two main types of statistical inference: 1. **Estimation**: This involves estimating population parameters (such as means or proportions) based on sample statistics.
The "spectrum of theistic probability" is not a widely recognized term in philosophical or theological discourse, but it can generally refer to the range of beliefs regarding the existence of a deity or deities, along with their implications for reality. This concept can be visualized as a continuum that includes various positions on the belief in God or gods.
Skewness risk refers to the risk associated with the skewness of a distribution, particularly in the context of asset returns or investment portfolios. Skewness is a statistical measure that indicates the asymmetry of a distribution. A distribution can be positively skewed (right-skewed) or negatively skewed (left-skewed): - **Positive Skewness:** This indicates that the right tail of the distribution is longer or fatter than the left tail.
Pinned article: Introduction to the OurBigBook Project
Welcome to the OurBigBook Project! Our goal is to create the perfect publishing platform for STEM subjects, and get university-level students to write the best free STEM tutorials ever.
Everyone is welcome to create an account and play with the site: ourbigbook.com/go/register. We belive that students themselves can write amazing tutorials, but teachers are welcome too. You can write about anything you want, it doesn't have to be STEM or even educational. Silly test content is very welcome and you won't be penalized in any way. Just keep it legal!
Intro to OurBigBook
. Source. We have two killer features:
- topics: topics group articles by different users with the same title, e.g. here is the topic for the "Fundamental Theorem of Calculus" ourbigbook.com/go/topic/fundamental-theorem-of-calculusArticles of different users are sorted by upvote within each article page. This feature is a bit like:
- a Wikipedia where each user can have their own version of each article
- a Q&A website like Stack Overflow, where multiple people can give their views on a given topic, and the best ones are sorted by upvote. Except you don't need to wait for someone to ask first, and any topic goes, no matter how narrow or broad
This feature makes it possible for readers to find better explanations of any topic created by other writers. And it allows writers to create an explanation in a place that readers might actually find it.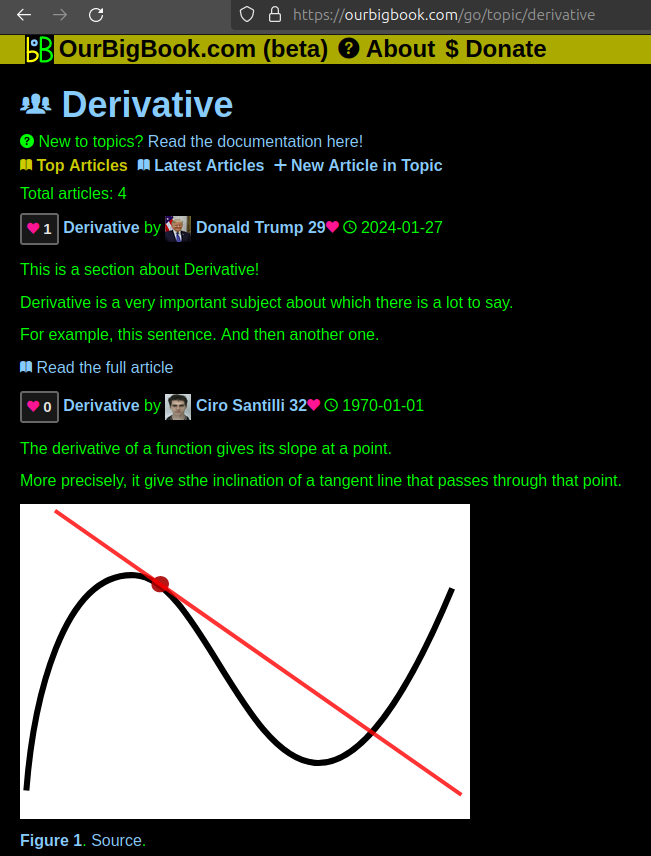
Figure 1. Screenshot of the "Derivative" topic page. View it live at: ourbigbook.com/go/topic/derivativeVideo 2. OurBigBook Web topics demo. Source. - local editing: you can store all your personal knowledge base content locally in a plaintext markup format that can be edited locally and published either:This way you can be sure that even if OurBigBook.com were to go down one day (which we have no plans to do as it is quite cheap to host!), your content will still be perfectly readable as a static site.
- to OurBigBook.com to get awesome multi-user features like topics and likes
- as HTML files to a static website, which you can host yourself for free on many external providers like GitHub Pages, and remain in full control
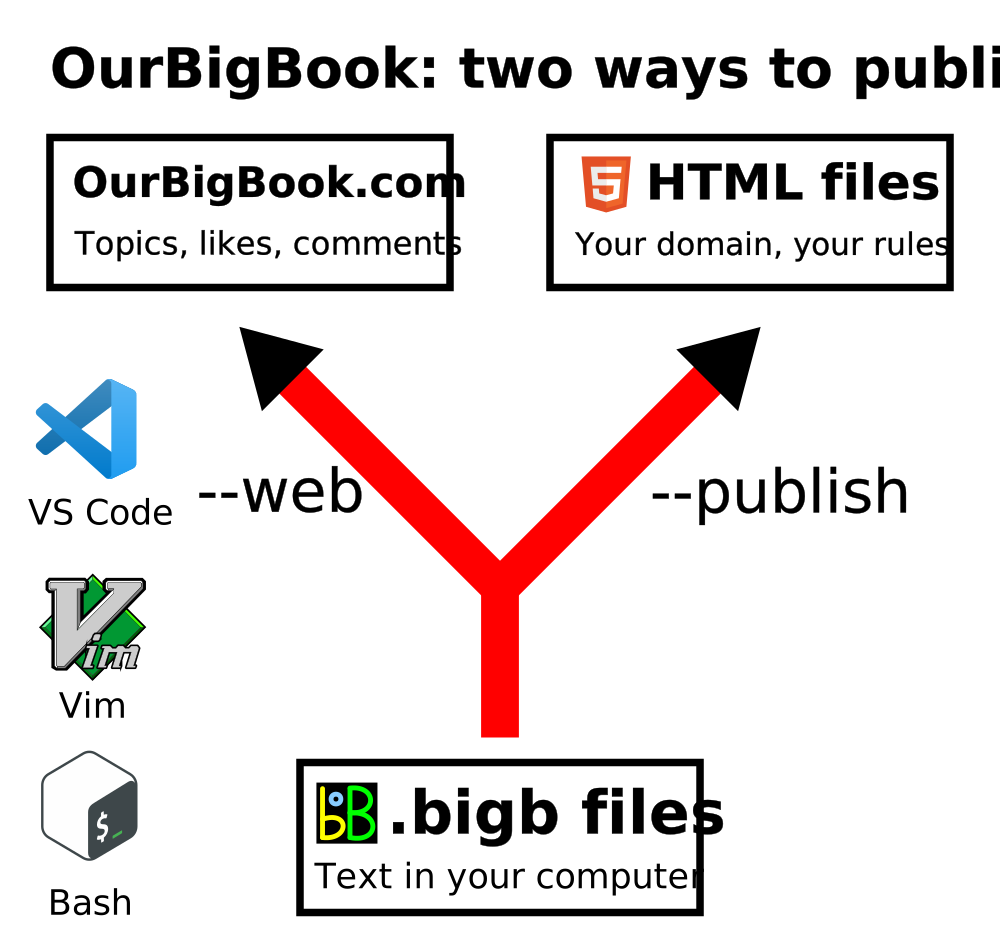
Figure 2. You can publish local OurBigBook lightweight markup files to either OurBigBook.com or as a static website.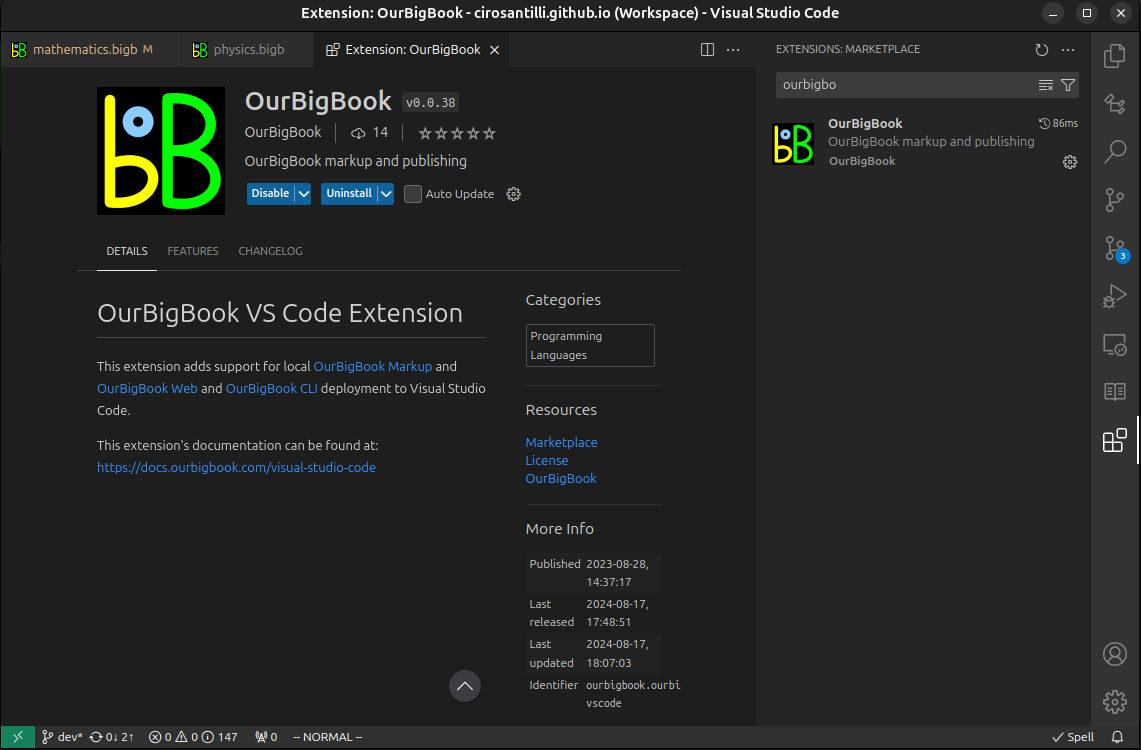
Figure 3. Visual Studio Code extension installation.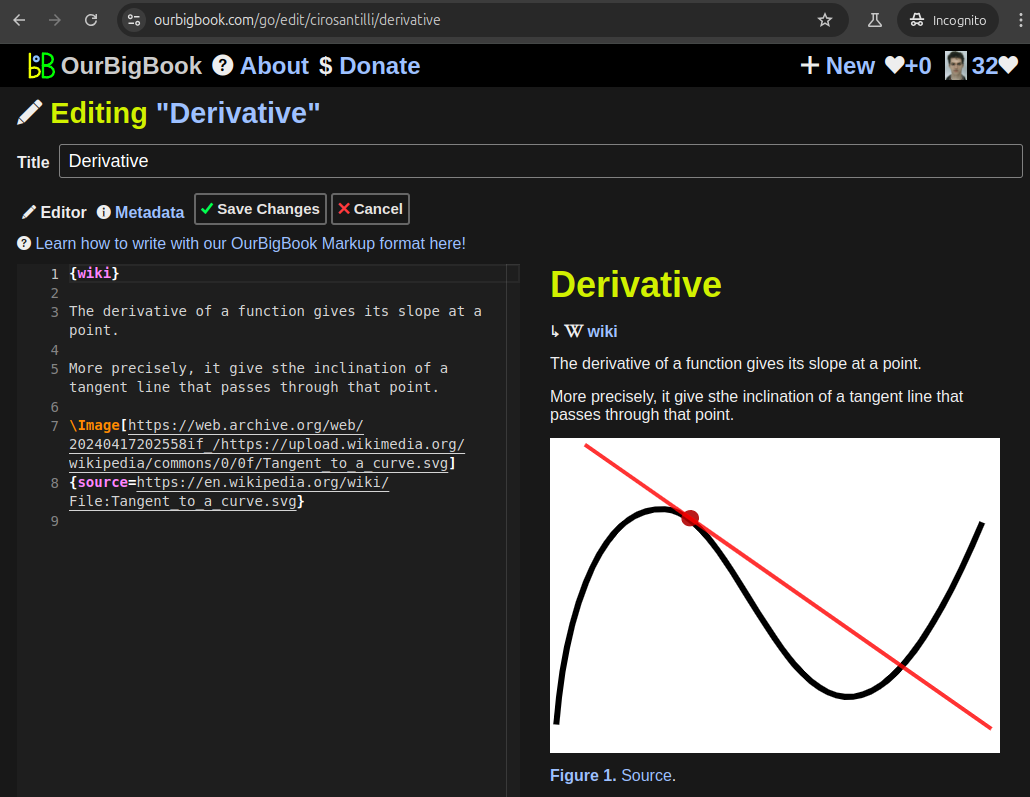
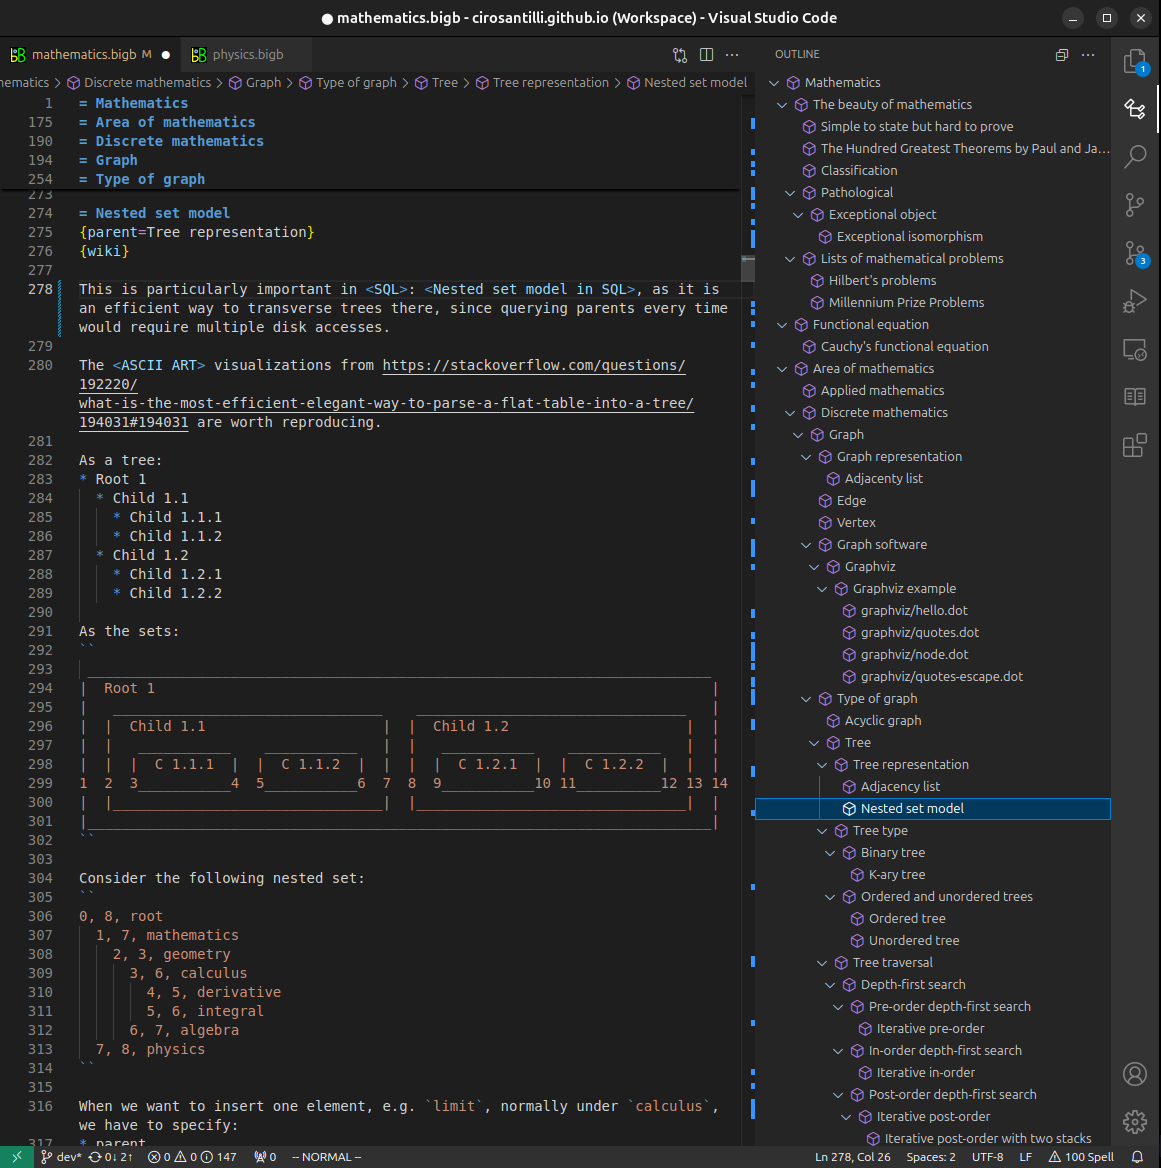
Figure 5. . You can also edit articles on the Web editor without installing anything locally. Video 3. Edit locally and publish demo. Source. This shows editing OurBigBook Markup and publishing it using the Visual Studio Code extension. 
- Infinitely deep tables of contents:

All our software is open source and hosted at: github.com/ourbigbook/ourbigbook
Further documentation can be found at: docs.ourbigbook.com
Feel free to reach our to us for any help or suggestions: docs.ourbigbook.com/#contact