Beer-Lambert calibration model
ID: beer-lambert-calibration-model

Choose an ideal absorbing chemical species with at a fixed wavelength, and a cuvette with geometric length . These are stipulated model parameters. A micromolar molar concentration is , so each additional gives . Five chosen standards therefore predictThe absorbance graph is a straight line of slope , while the transmittance graph shows exponential decay. Equal increments of molar concentration multiply transmittance by ; they do not subtract a fixed transmitted fraction.
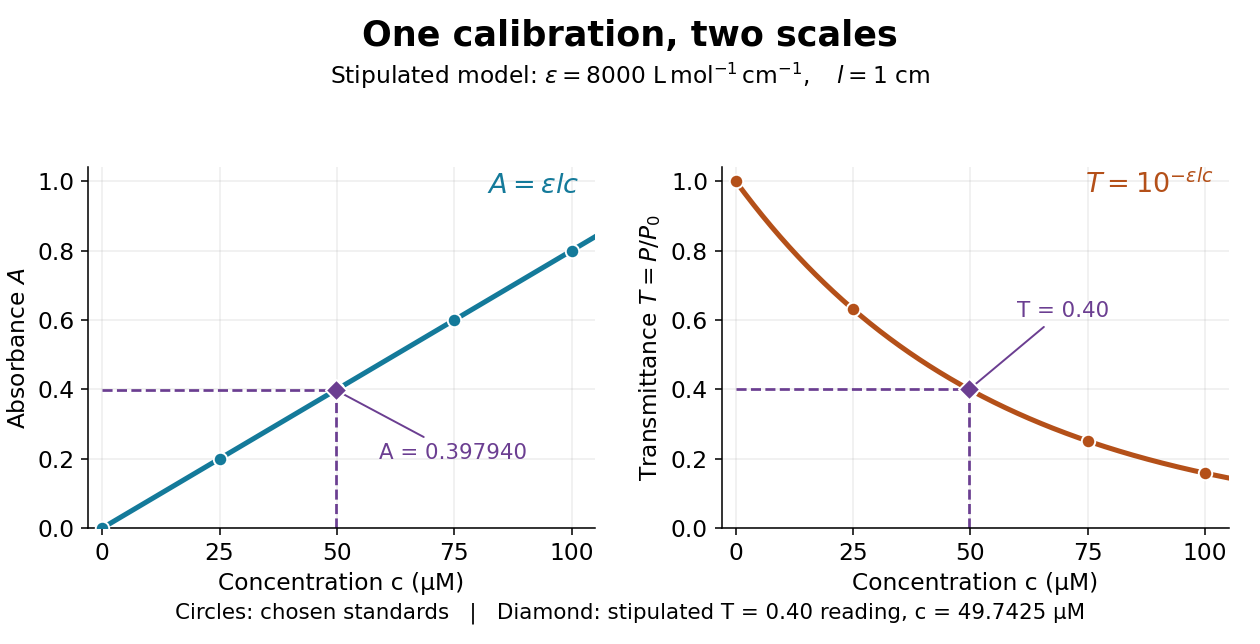

Suppose a measurement returns the stipulated blank-normalized reading under those same conditions. The inferred absorbance and molar concentration areThis lies slightly below the standard because is slightly above . A calibration determined experimentally by linear regression may instead have . Then use , keeping the slope and intercept in their measured units. A nonzero intercept calls for checking the reference blank and sample preparation; it does not uniquely identify the cause.
New to topics? Read the docs here!