
An electropherogram is a recorded trace of an electrophoresis separation. In capillary electrophoresis, it commonly plots detector signal against migration time: separated populations reach a detection window at different times and produce peaks. Peak position, width, height and integrated area describe different features of that trace.
The position depends on the migration mechanism and geometry. In a simple uniform-field model with detector distance , electric field , electrophoretic mobility and electroosmotic flow represented by mobility ,when the resulting drift is towards the detector. A changed buffer-flow contribution can therefore shift migration times without changing the analyte's identity. The instrument's actual timing and mobility conventions must be specified; the first-party software documentation gives its explicit migration-time and apparent-mobility definitions.[ref]
An electropherogram peak area is the integral above an assigned baseline. For an original Gaussian-component model,The component area is , while its height above baseline is . Choose and in compatible signal/minute units. The two component heights are equal, although the second has twice the integrated signal. These are synthetic components, not experimental analyte concentrations.
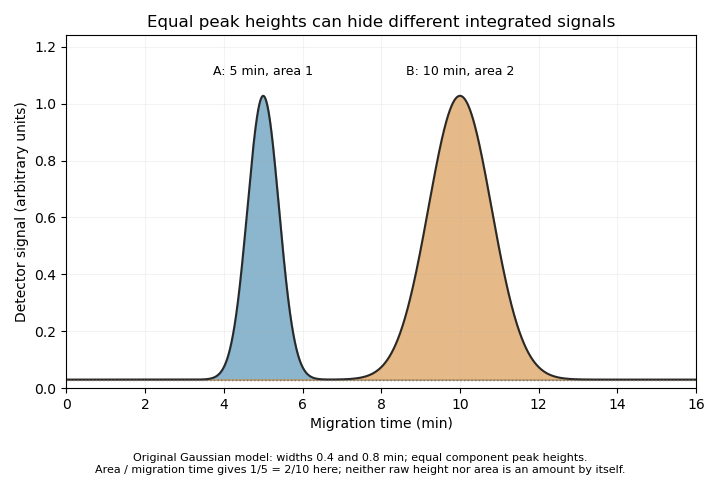

The cited software defines time-corrected area as .[ref] In this example, both corrected areas are . This is another observable, not permission to equate every corrected area with an absolute amount without response calibration and an appropriate measurement model.
A peak can also contain unresolved co-migrating species. Its apparent simplicity does not establish chemical purity. Useful interpretation therefore combines the trace with baseline selection, migration references, detector response and independent identification evidence, rather than treating each visible peak as a complete chemical explanation.
New to topics? Read the docs here!