A signal is a function or sequence representing a quantity that carries information. An electric potential difference measured over time can be written ; regularly recorded values give a discrete-time signal . The meaning includes the measured quantity, units, time reference and sampling interval. The same list of numbers sampled once per second or once per millisecond describes different physical frequencies.
The rectangular function has value one on and zero on . Endpoint values are convention-dependent and do not affect its ordinary integrals or Fourier transform. Shifts, amplitude changes and time rescaling produce a rectangular pulse of arbitrary height, center and duration. With , for the width- pulse has Fourier transform , with value at zero by a limit. Its convolution with itself is a rescaled triangular function, on and zero outside, because the convolution measures the overlap length of two intervals.
A discrete-time signal assigns a value to each of a discrete collection of times, often indexed by the integers. Regular sampling at rate gives , so a sinusoid with normalized frequency cycles per sample has physical frequency . Discreteness of time does not itself require the amplitudes to be quantized; rounding the values is an additional operation. The Nyquist–Shannon sampling theorem gives conditions for recovering a band-limited continuous signal from its samples.
Noise is unwanted variation in a signal. Whether a component is unwanted depends on the measurement task: suppressing fast variation helps only when that variation is expendable. White noise provides one mathematical model; it does not describe every source of disturbance. A linear filter may reduce some noise while also altering the desired signal.
Improve a circuit's signal-to-noise ratio by reducing unwanted coupling and physical noise sources while retaining the signal bandwidth. Important methods include lowering appropriate resistances or temperature to reduce thermal electrical noise, controlling leakage and bias currents relevant to shot noise, minimizing pickup with shielding and small loop area, and selecting an operational amplifier for the source electrical impedance. Filtering limits integrated noise only if it preserves the information-bearing spectrum; a lock-in amplifier can move detection above a flicker noise region and select a narrow band. Uncorrelated noise variances add, whereas coherent pickup requires its phases and correlations to be considered. Repeated averaging reduces independent random error, but does not remove an arbitrary systematic error or slow drift.
Low-frequency noise with an approximately inverse-frequency power spectral density over a specified range. It can dominate the flat spectrum of a weakly confined mechanical coordinate or an electronic readout at low frequencies. A law cannot hold with finite total variance over unlimited frequency range, so its measured bandwidth and low-frequency cutoff matter. An observed excess alone does not uniquely identify the microscopic source.
Fluctuations associated with nonzero temperature, including mechanical Brownian motion and electrical noise.
Shot noise is fluctuation associated with discrete transfer events. For an electric current, individual charge carriers contribute finite amounts of electric charge, even when a meter displays a smooth mean. The simplest model is a stream of equal, independently arriving charges with constant rate: its Poisson process predicts both the mean electric current and the variance around it. Discreteness alone does not imply a Poisson distribution; the timing and correlations matter.
The useful surprise is that noise can reveal something a mean hides. Two devices can carry the same mean electric current yet have different fluctuations because one transfers charges independently and the other groups or regulates them. A calibrated shot noise photocurrent measurement can connect a macroscopic voltage variance to the elementary charge. Thermal electrical noise instead exists in an unbiased resistor at thermal equilibrium; a measured background can contain both mechanisms.
Walter Schottky's 1918 paper Über spontane Stromschwankungen in verschiedenen Elektrizitätsleitern treated amplifier sensitivity limits. Part II considered independent discrete transfers, including thermionic emission through a vacuum. On p. 563 he proposed amplifying fluctuations from a separate discharge tube to determine the elementary charge; those experiments were prospective, not reported results.[ref]
Über spontane Stromschwankungen in verschiedenen Elektrizitätsleitern by Walter Schottky. Schottky (1918), p. 541; Part II, pp. 547–552; p. 563, proposed experiment
For independent photon detections with a fixed mean rate, counts in a fixed exposure have a Poisson distribution, so the variance equals the mean. Multiplying by a representative photon energy gives . A source-only signal-to-noise threshold therefore needs an expected photons. Background, detector noise, variable illumination and photon correlations can invalidate that source-only formula.
Independent arrivals of charges at rate give a Poisson distribution for the number in time , with mean and variance . Since and , its variance is . This agrees with integrating the one-sided shot noise power spectral density through the averaging filter: its effective noise bandwidth is . A two-sided convention instead assigns density to each sign of frequency.
Let be the magnitude of each transferred electric charge, and let arrivals form a Homogeneous Poisson process of rate . Extend the stream over past and future times when considering stationary filtering. For electrons, , the elementary charge. Choose the positive electric current direction to follow these transfers, so is its mean magnitude. If counts arrivals in a gate of duration , thenThe gate's transferred electric charge is , and its average electric current is . Scaling the expected value and variance givesMore arrivals increase the absolute fluctuation but decrease its size relative to the mean. For an original count example with , the mean count and its variance are both , the standard deviation is , and the relative standard deviation is . The probability of no transfer is ; the probability of four is . A constant arrival rate does not prescribe four arrivals in every gate.
These are fluctuations of a time average, not the variance of an ideal instantaneous electric current. A model of point transfers has arbitrarily sharp impulses; it acquires a finite measured variance only after specifying a gate or linear filter. Actual collection pulses have finite duration and electrical circuits have finite response times.
Write an ideal point-transfer model using the Dirac delta function:For this arrival stream with independent increments, distinct arrivals contribute the product of the means, which cancels when centering. The same-arrival term leaves the autocovarianceIts Fourier transform gives the two-sided power spectral density, while folding negative frequencies onto positive ones gives the one-sided convention:These spectra describe , excluding the spectral line from the mean direct current. The amplitude spectral density is in ; it is not a root mean square electric current until a measurement signal bandwidth is specified. Approximate white noise requires frequencies low enough that the single-transfer pulse shape and any correlations can be neglected. Neither the ideal impulses nor a flat spectrum extending to infinity describe a real detector at every timescale.
All spectra above are per hertz, with in cycles per second. One possible angular frequency convention defines a density integrated using alone. Since , it hasAnother common convention keeps the numerical density but integrates it with . State the integration measure as well as whether a spectrum is one-sided: a change of variable and a folding of signs are separate operations.
Let be the complete current-to-voltage frequency response from detector input to readout, in . For a real stable linear time-invariant system, the shot contribution to the output voltage variance isIf with feedback electrical resistance , a reference voltage gain , and dimensionless normalized frequency response , thenThis is the effective noise bandwidth for unit reference magnitude. The transimpedance amplifier factor converts electric current to voltage; multiplies voltage. Neither is an additional noise source merely because it amplifies an existing fluctuation. In contrast, a real amplifier adds input voltage noise and input current noise, and its feedback resistor contributes thermal electrical noise. Those terms need their own transfers to the output. In particular, input voltage noise generally has a different transfer from an injected detector electric current. Simply multiplying every input specification by is incorrect.
For a unit-gain exponential low-pass filter, with time constant ,The cutoff frequency is not . An independent time-domain derivation sums independent event contributions to giveThe same reasoning for a rectangular averaging gate has on and zero elsewhere, hence effective noise bandwidth and variance , agreeing with the shot noise counting model. Equal numerical durations do not make these two different linear filters equivalent.
For an original model, set , , , , and the exponential low-pass filter's . Assume an ideal detector without charge multiplication and omit all additive noise for this calculation. ThenDoubling doubles the voltage variance and multiplies its standard deviation by . Halving also doubles the variance, provided the detector remains approximately white throughout the enlarged passband. Using in place of underestimates the variance by the factor . These are calculated predictions, not measured values or settings claimed for the laboratory below.
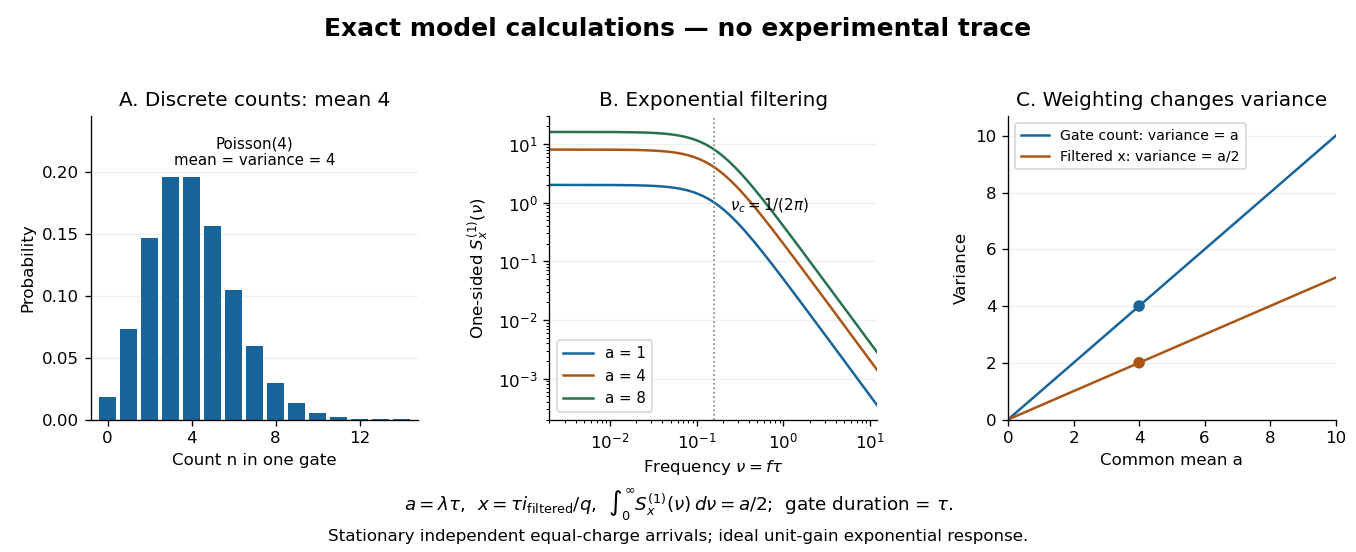
To read the dimensionless figure, set and , with frequency in cycles per unit . A gate of duration has count mean and variance . The continuously filtered instead hasThe count and the filtered electric current are different observables. The factor comes from the exponential weighting, not from non-Poisson arrivals. The dimensionless count illustration is a separate choice of rate; it does not assert that the example has only four electrons per .
MIT's guide uses an illuminated vacuum photodiode, with collecting anode positive relative to the emitting cathode. A transimpedance amplifier gives ; a multimeter reads its mean. The fluctuation path rejects below , adds roughly tenfold voltage gain, then nominal hundredfold preamplification and a – band-pass filter; the readout measures root mean square voltage. With diode bias off, a sinusoid at the test port calibrates . Restore bias, retain gain settings, vary lamp brightness, and repeat both readings. The guide warns about overload; it supplies a procedure, not measured results.[ref]
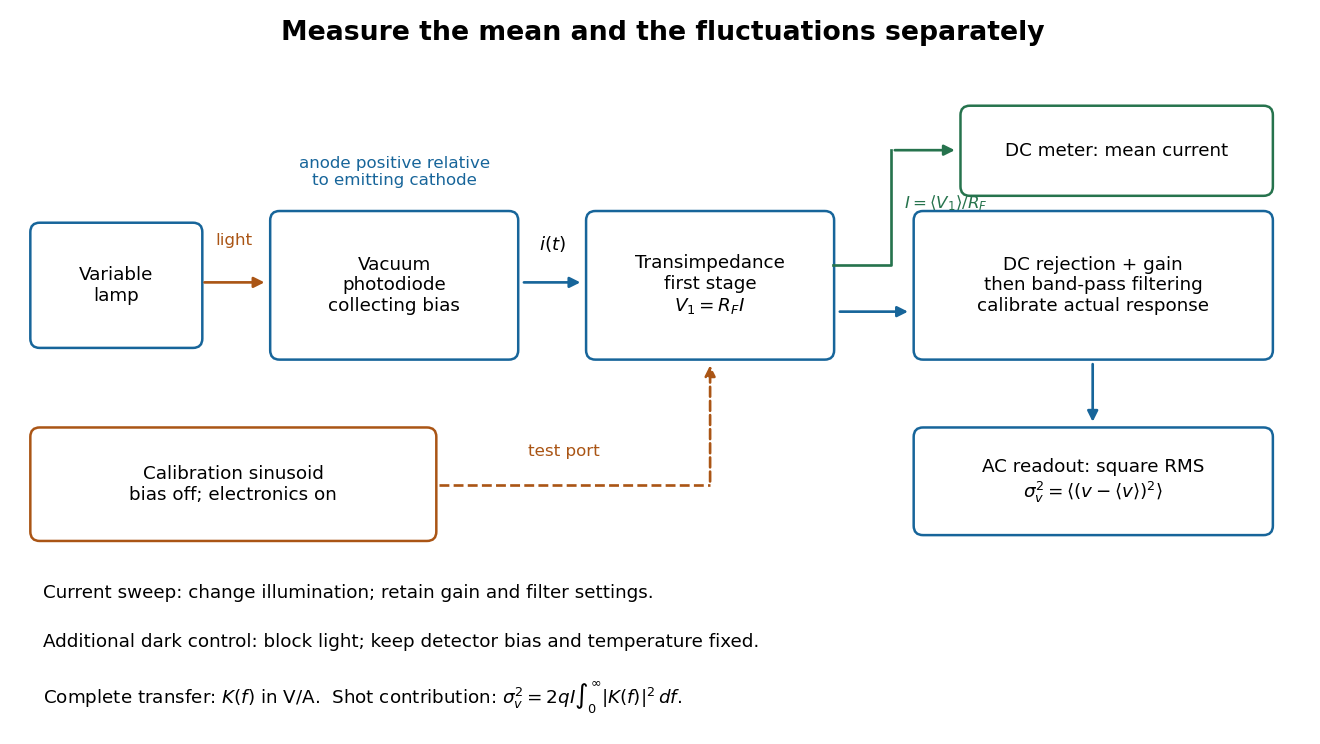
Functional photocurrent measurement: separate mean-current, fluctuation and calibration paths
. Original functional diagram organizing the laboratory's measurement roles; it is not a component-level circuit reproduction. includes current-to-voltage conversion and the complete fluctuation path. The dark comparison below is an additional control. Details.The inference can be expressed without relying on nominal passband edges. Let denote the calibrated voltage transfer after the conversion, so and define . Under independent arrivals and an unchanged additive background,The slope of voltage variance against mean electric current can therefore estimate . A free intercept accounts for a constant background; forcing the line through zero generally biases the slope. The root mean square readings must have their mean removed and then be squared. Subtracting two root mean square amplitudes does not subtract independent variances. Estimate the variance from successive records; averaging the waveforms first would suppress the fluctuation being measured.
Additional controls sharpen this interpretation. Block the light with detector bias, temperature, and gain unchanged; this preserves dark current and electronics while removing photocurrent. Repeat this dark comparison between illumination settings to check drift. If independent dark arrivals have mean magnitude and illuminated arrivals add , their spectra add: . Subtracting the unchanged dark variance isolates . This subtraction model assumes unchanged transfers and independence; switching off bias for gain calibration is a different control and need not preserve the dark background.
Vary measured rather than assuming lamp knob position is proportional to photocurrent. Check collection versus bias to identify a range where incomplete collection is negligible; a space charge limited tube can correlate transfers. Verify that the transimpedance amplifier remains linear and that its frequency response is unchanged over the illumination range. Changing signal bandwidth should change the excess variance through ; compare inferred input spectra in several bands. Correlated fluctuations of the light source can add a contribution scaling approximately as , while an electronics floor can hide the linear term at small electric currents. A fitted line over a short range alone does not establish independent transfers.
The gain calibration must include the same detector-to-readout path used for noise, or explicitly supply any omitted transfer. Detector capacitance, finite collection time, amplifier voltage and current noise, thermal electrical noise, pickup, clipping, and finite recording precision limit the inference. Current-dependent electrical impedance or heating can make a background current-dependent too. Since contains squared gain, a small fractional error in gain produces approximately twice that fractional error in the predicted variance scale. Knowing a nominal gain and two cutoff settings is insufficient.
The Fano factor compares count variance with its mean over a specified gate. For a stationary unidirectional stream with fixed charge , finite count second moments, and a generalized autocovariance with finite integral so that the long-gate limit exists,The zero-frequency relation concerns the continuous fluctuation spectrum, excluding the mean spectral line. It follows by writing as the double integral of the current autocovariance; for long , its leading term is . A finite-gate , a frequency-dependent ratio , and a factor inferred from one filtered variance are not interchangeable. The last is weighted by the instrument's .
Two original counting counterexamples show why electric charge discreteness is insufficient. In independent time slots, transfer one charge with probability in each slot: the binomial distribution gives mean , variance and Fano factor . A random common origin for the slots removes a preferred time origin; the long-gate factor remains . Alternatively, if independent Poisson process bursts each transfer exactly two charges, then gives and factor . Both count individual charges; only the first model allows at most one per slot, and the second groups them in pairs.
Consequently is a reference for independent unidirectional arrivals, not a universal noise law for all electrical conductors. Correlations, charge multiplication, and bidirectional transfer require a more specific model. For example, independent opposite streams with positive current magnitudes and have net mean but one-sided fluctuation spectrum . Using would miss their fluctuations when the net current is small. At thermal equilibrium, the full transport model must also respect thermal electrical noise; adding unrelated phenomenological formulas can double count the same underlying transfers.
Thermal electrical noise is the fluctuating electric potential difference or electric current produced by thermal fluctuations in a dissipative electrical circuit, even without an applied voltage. A resistor at thermal equilibrium is both a source of noise and a sink for electrical energy. Its electrical resistance describes the dissipation, and its absolute temperature sets the scale of the fluctuations. This connects a practical limit on signal-to-noise ratio to statistical mechanics: a warm, unbiased resistor is not electrically silent.
John Bertrand Johnson measured the effect using a vacuum-tube amplifier and thermocouple; his 1928 paper reported agreement with the Boltzmann constant. Harry Nyquist's companion paper calculated the effect from thermodynamics and statistical mechanics.[ref]
Thermal Agitation of Electricity in Conductors by John Bertrand Johnson. Johnson, Thermal Agitation of Electricity in Conductors, Physical Review 32, 97–109 (1928), abstract: amplifier and thermocouple measurement
[ref]Thermal Agitation of Electric Charge in Conductors by Harry Nyquist. Nyquist, Thermal Agitation of Electric Charge in Conductors, Physical Review 32, 110–113 (1928), abstract: thermodynamic and statistical calculation
Model an ideal resistor of constant electrical resistance at uniform absolute temperature by its Thévenin equivalent: a zero-mean random voltage source in series with a noiseless . In the classical range its one-sided, open-circuit voltage power spectral density, per hertz, iswhere is the Boltzmann constant. Thus a positive-frequency interval of width contributes to the mean square voltage. This is approximately white noise only where the electrical resistance is effectively constant and , with the Planck constant. The ideal constant spectrum cannot describe arbitrarily high frequencies.[ref]
For a real voltage, an equivalent two-sided power spectral density is over signed frequencies. With a real linear time-invariant system of frequency response , the same output mean square isAngle brackets denote an expected value; for this zero-mean noise the mean square is its variance. Do not integrate over both signs of frequency: that counts the same fluctuations twice. All integrals here use frequency in hertz, not angular frequency . The amplitude spectral density is in , whereas the root mean square voltage requires a specified measurement signal bandwidth.
For a linear filter with chosen nonzero reference voltage gain , define its effective noise bandwidth byThis is the width of an ideal rectangular linear filter with gain magnitude passing the same mean square of input white noise. ConsequentlyUse the full voltage transfer from the open-circuit voltage source to the readout, including any electrical load, when applying this formula. A nominal signal bandwidth stated between two cutoff frequencies does not specify the integral: gradual tails and a nonuniform passband matter. For an ideal rectangular unit-gain passband , . For an unloaded RC low-pass filter with and cutoff frequency ,The last equality follows by substituting and integrating as . Using the nominal as the noise bandwidth underestimates the variance by a factor , or the root mean square voltage by .
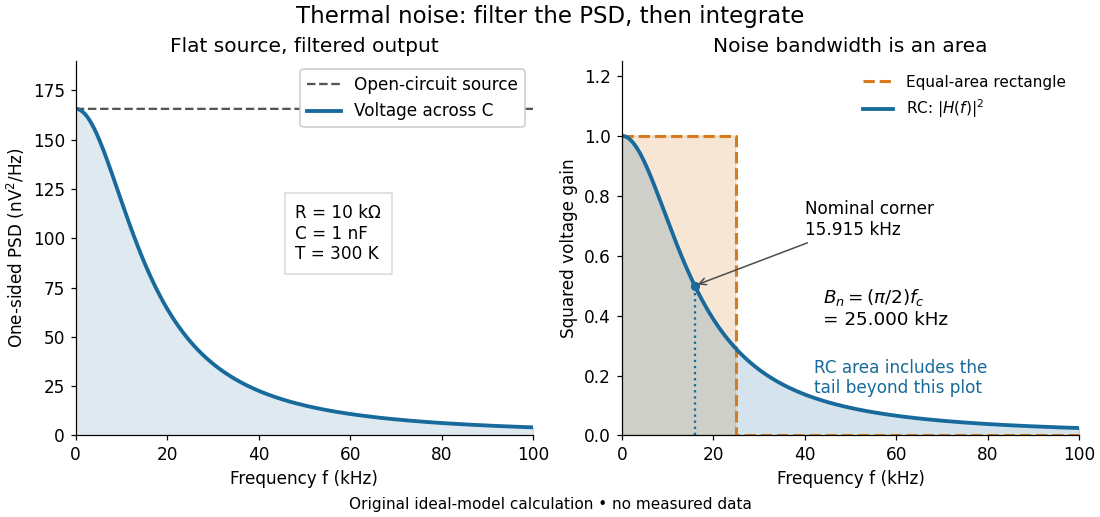
Equal-area bandwidth for filtered thermal electrical noise
. Original analytical illustration for , , and . The left panel shows the one-sided open-circuit voltage power spectral density and the output spectrum of an unloaded RC low-pass filter. The right panel compares the squared frequency response with an equal-area ideal rectangular linear filter; the shaded RC area continues beyond the plotted range. The nominal corner is , whereas the effective noise bandwidth is . Calculated curves, not measured data. Details.An external electrical load changes the terminal noise. Connecting a purely resistive load to the noisy resistor gives the voltage divider ratio . The source resistor's contribution at the load isIn a rectangular signal bandwidth , the power delivered by that source contribution to the load isbecause . Equality occurs at : this is matched available noise power. Matching halves the voltage, quarters its power spectral density, and gives . Dividing the squared open-circuit voltage by would instead give four times this available power.
These expressions isolate the source resistor's contribution. A real load resistor also generates thermal electrical noise. At the same temperature its independent contribution produces the equal reverse power flow, so the net thermal power transfer is zero at thermal equilibrium. For example, two equal resistors at the same temperature have total terminal power spectral density , equivalent to . One contribution alone is . The fictitious noiseless series in the Thévenin equivalent is not an additional physical source: adding its noise again would double count the original resistor.
For an original hypothetical calculation, stipulate , , and an ideal rectangular measurement signal bandwidth . Using givesA matched electrical load receives root mean square from the source resistor, giving . These are stipulated model predictions, not laboratory measurements. Increasing raises the open-circuit voltage noise but does not increase the matched available power. Restricting the measurement signal bandwidth reduces root mean square noise as its square root; it improves signal-to-noise ratio only if the desired signal is preserved.
Connect one physical resistor across an ideal lossless capacitor , with no applied source and an ideal readout that draws no electric current. Represent the resistor by its noisy Thévenin equivalent. The resulting RC low-pass frequency response gives the stationary capacitor voltage power spectral densityIts mean square follows by the effective noise bandwidth calculation:This is also the equipartition theorem: the mean capacitor energy is . Raising makes the low-frequency spectrum taller and its width narrower in exactly compensating proportions. It changes the equilibration time , not the final variance.
The integral to infinity belongs to the ideal classical model. For a physical electrical circuit, assume thermal equilibrium, linear components with negligible extra dissipation, and a corner far below the frequencies where parasitic effects, frequency-dependent electrical resistance, or invalidate the model; the omitted high-frequency tail must be negligible. A finite-bandwidth instrument measures only part of this variance. Its input capacitance contributes to the total , and its finite input electrical resistance introduces both loading and its own thermal electrical noise.
For and , the predicted equilibrium variance is and the root mean square voltage is . At , and . At , and ; the equilibrium root mean square voltage is identical.
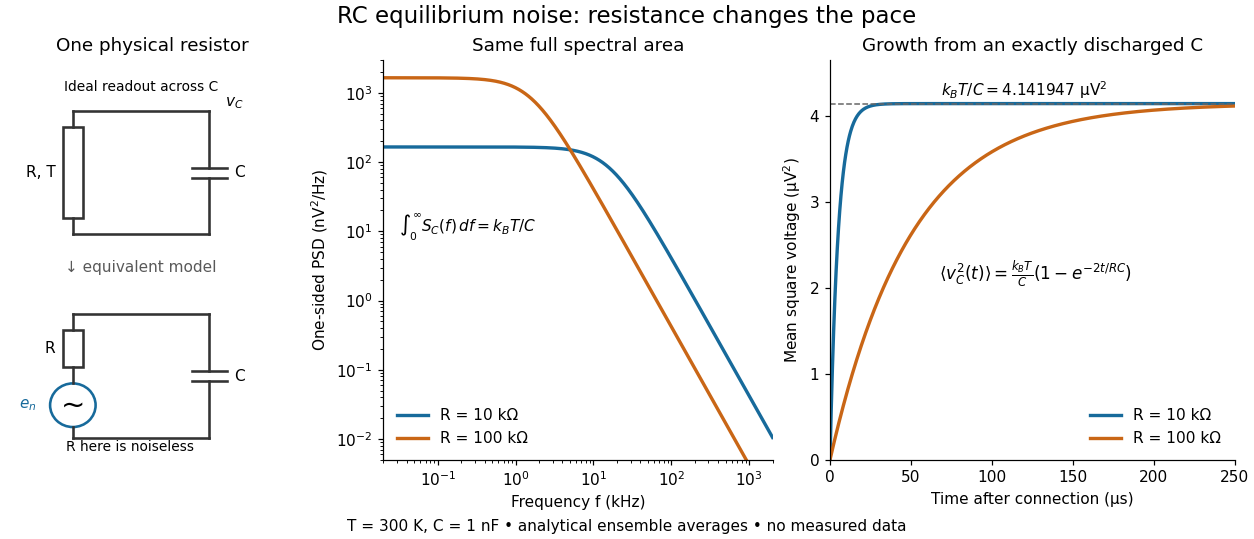
To obtain the growth curve, prepare exactly and connect the resistor at while maintaining its temperature. The RC low-pass filter's causal impulse response is for . Classical ideal white noise with two-sided power spectral density givesThe factor here is the two-sided time-domain noise intensity; the equilibrium spectral integral above used the one-sided . They give the same long-time limit. The variance approaches equilibrium with time constant , although a deterministic initial voltage decays with time constant . If the capacitor already starts in thermal equilibrium, its initial variance supplies the missing exponentially decaying term and the total variance stays constant.
MIT's laboratory guide mounts resistors on an aluminum box beneath a metal beaker shield, with short twisted leads. Its SR560 amplifier uses nominal gain before a Krohn-Hite – band-pass filter; an oscilloscope reads root mean square voltage. Calibration sweeps an attenuated sinusoid and measures the actual gain . Students alternate the resistor and a short circuit, subtracting squared readings , and disconnect the ohmmeter during noise acquisition. Lead and input capacitance enter the gain-squared integral. With settings unchanged, varying electrical resistance or temperature tests the predicted mean square. The guide prescribes repeated readings and warns against averaging noise waveforms to zero. This is a documented teaching protocol, not a supplied dataset of measured outcomes.[ref]
Johnson Noise and Shot Noise: The Determination of the Boltzmann Constant, Absolute Zero Temperature and the Charge of the Electron by MIT Department of Physics. MIT Department of Physics, Johnson Noise and Shot Noise, pp. 5–9: equation (13), apparatus §III, calibration §IV.1, Figure 5, and shorted-input subtraction equation (20)
The subtraction requires care: shorting the input changes the source electrical impedance. An amplifier's input current noise can therefore produce different voltage noise in the two configurations; a shorted baseline alone does not remove that contribution. Gain drift, interference and insufficient observation time also limit the inference. These are limitations of interpreting the measurement, not corrections that can be inferred from the nominal signal bandwidth alone. In an independent analysis one would compare the measured difference withwhere represents the measured shunt capacitance and excludes that separately modeled shunt. If calibration already includes the same shunt response, applying the denominator again counts the attenuation twice. The thermal noise worked example and both original figures illustrate ideal models; they claim no measured agreement or measured value of the Boltzmann constant.
A signal-to-noise ratio compares a chosen measure of a signal with the corresponding noise measure. For a constant measured electric potential difference and a root mean square noise voltage , an amplitude ratio is ; the corresponding power ratio under equal electrical resistance is its square. State the convention and measurement signal bandwidth, since changing either changes the numerical ratio.
A power spectral density distributes the mean square of a signal over frequency. Its integral over the specified frequency domain gives that mean square. State whether the convention is one-sided or two-sided and whether frequency is measured in hertz or as angular frequency. For a zero-mean stationary signal, the mean square is its variance; spectral density of a stationary process gives the discrete-time convention.
A cross-spectrum relates the Fourier transforms of two random fields or two stochastic processes. The cross-spectrum of two stationary time series gives the discrete-time case.
For statistically homogeneous random fields, the three-dimensional cross-power spectrum is defined byunder the Fourier transform convention . For isotropic fields it depends only on . A deterministic relation implies . An angular cross-power spectrum is defined analogously from spherical harmonic coefficients.
An amplitude spectral density is the square root of a power spectral density. For an electric potential difference expressed in volts and frequency in hertz, its units are .
Articles by others on the same topic



Signal is a private messaging application that prioritizes security and user privacy. It is designed for sending text messages, making voice and video calls, and sharing media and files. Developed by the Signal Foundation, Signal uses end-to-end encryption to ensure that only the sender and recipient can read the messages, making it highly secure against eavesdropping.