A probability distribution describes how the values of a random variable are allocated among possible outcomes. More precisely, the law of a random variable assigns each measurable set the probabilityIt is a probability measure on the values of . The underlying experiment can be more elaborate than the output: different experiments may produce the same probability distribution. The law of a random variable retains the probabilities needed to answer questions about that output. [ref]
https://ocw.mit.edu/courses/6-436j-fundamentals-of-probability-fall-2018/9797310bed4c7f5b5d40d007783eec8d_MIT6_436JF18_lec04.pdf. MIT Fundamentals of Probability, Lecture 4: random variables and their laws
.For a finite example, let take values with probability mass function , , . Its probabilities sum to one. The event has probability , whereas has probability : including one endpoint matters when it carries positive probability.
For a contrasting random variable , choose the probability density function on , and zero elsewhere. It integrates to one. Now , while every single outcome has probability zero. The probability density function can have height : probabilities come from integrals over outcome ranges.
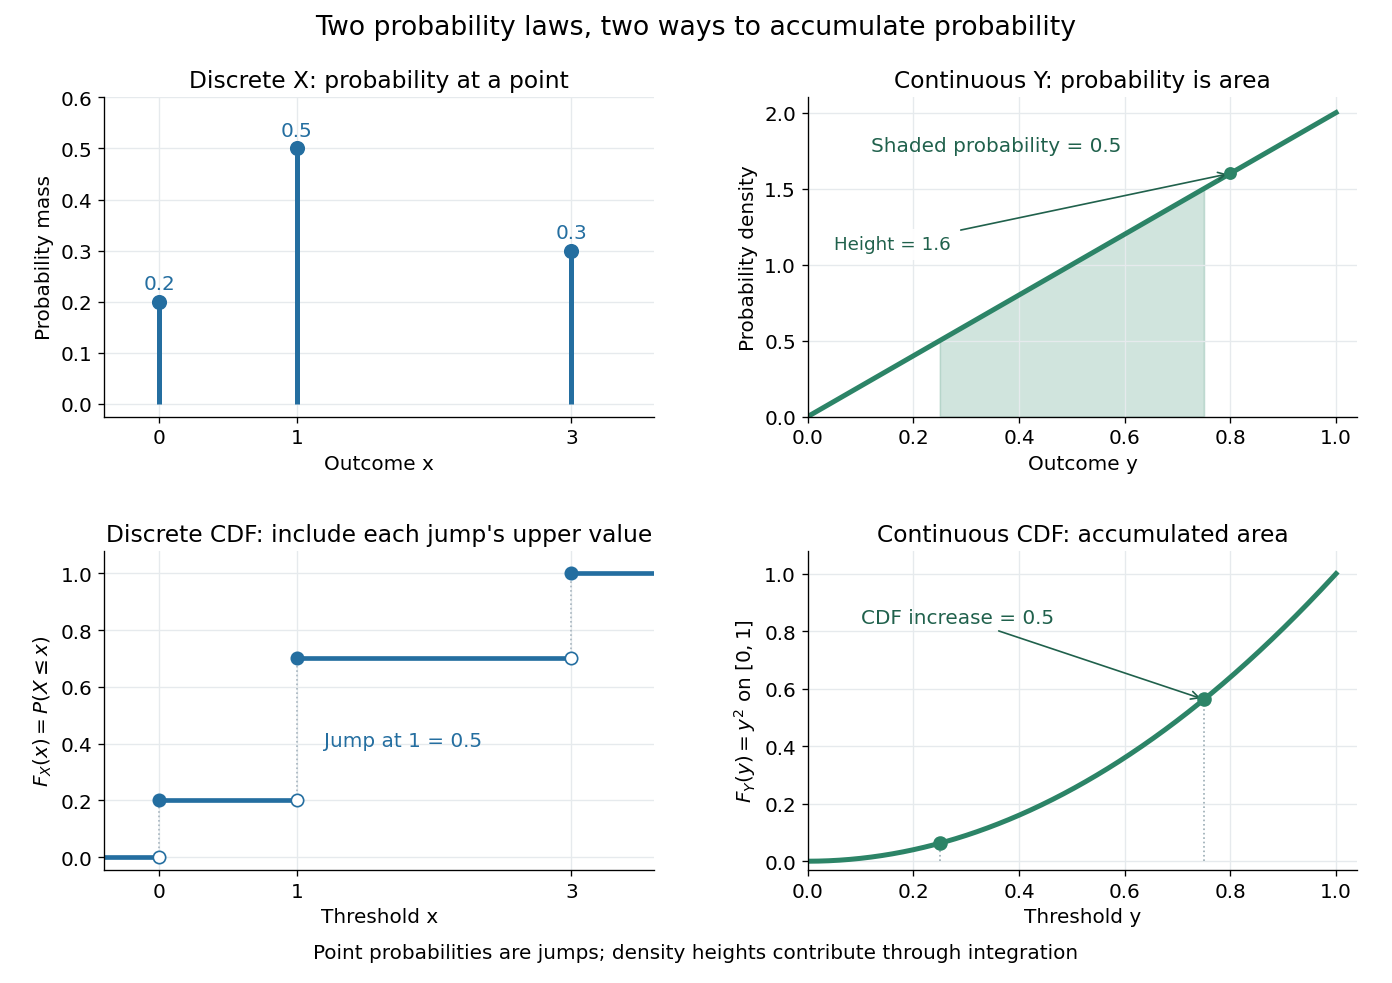
The cumulative distribution function answers all threshold questions for a real random variable, regardless of whether there are jumps or a probability density function. A quantile function reverses the direction of the question: given a cumulative probability level, find a threshold. This connects descriptive summaries to inverse transform sampling, which constructs a chosen probability distribution from a uniform distribution.
A probability vector lists the probabilities of the outcomes in a finite sample space. Its entries are nonnegative and sum to one, so a column probability vector is a point of a probability simplex. Row and column conventions describe the same probability distribution, but they determine whether a stochastic matrix acts on the right or its transpose acts on the left.
A probability mass function with finite positive-mass support, nonnegative masses and total mass one. Listing its support means listing exactly positive-mass outcomes once, excluding zero-probability endpoint outcomes. A computational interface returning floating-point masses generally approximates exact rational or real probabilities.
Given two finite probability distributions, assign the product of their probability masses to each ordered pair. The support is the Cartesian product of the two positive-mass supports. Distributivity gives . This is the joint distribution for independent coordinate outcomes; it is a construction from the marginals, not a claim that arbitrary jointly observed coordinates are independent.
For a nonempty finite sample, assign each distinct observed value its relative frequency. The observed values form the finite positive-mass support; the counts sum to the sample size, so the probabilities sum to one. Repeated observations increase the same outcome's mass rather than adding repeated support entries.
For a finite probability distribution with support and a total function , assign each image value the combined mass of its preimages. Its support is exactly the finite image , listed without repetitions. Every listed mass is positive because it contains at least one positive source mass.
The fiber of a function construction gives a set partition of , so finite summation gives . This proves nonnegativity and normalization without assuming that is injective. In code, mapping support values and then overwriting repeated image keys is incorrect; repeated keys must have their masses added. For example, mapping a uniform distribution on four consecutive integers to parity produces two outcomes with mass one half each.
The probability distribution of a nonnegative duration until an event. For a continuous duration with survival function , its probability density function is . A constant hazard gives an exponential distribution; successive independent first-order waits give a convolution, as in the two-step catalytic waiting time.
The convolution of two independent sequential exponential waiting times has the displayed normalized density and mean . At equal rates its limit is . A measured density of this form supports a multistep kinetic mechanism without uniquely identifying its hidden chemical intermediates.
A probability distribution is self-decomposable if, for every , an independent remainder can be chosen so that the displayed equality in distribution holds. A normal distribution admits a normal distribution remainder with mean and variance . For an exponential distribution of rate , choose with probability and otherwise an independent exponential distribution of rate . Its moment-generating function is ; multiplication by proves the claim using the uniqueness theorem for moment-generating functions.
A probability distribution assigns total probability one to its sample space. For a nonnegative probability density function this means that its integral over the full domain equals one; for a probability mass function the sum of its masses equals one. A nonnegative integrable function with positive finite integral can be divided by that integral to normalize it. A negative function cannot be a probability density function even if a formal manipulation purports to normalize it.
A mixed probability distribution combines a discrete probability distribution with a continuous probability distribution. For example, put probability at zero and probability into a uniform distribution on . Its cumulative distribution function is for , for , and for . The jump at zero and the continuous increase both contribute; neither an ordinary probability density function alone nor a probability mass function alone describes the whole law.
Let , and . With probability , take ; otherwise draw an exponential distribution of rate . This mixed probability distribution has a negative atom and a continuous nonnegative component. Its moments are and . The law of total variance equivalently gives .
When , conditioning on selects exactly the exponential component, so for . An ordinary probability density function for the continuous component integrates to , not one; the missing mass is the atom, not a normalization error.
For and , this mixed probability distribution has probability mass at zero and ordinary probability density function on . That ordinary density integrates to , not to one; conditioned on , the law is the uniform distribution on . Its cumulative distribution function is zero for , for , and one for .
For each positive integer , integration gives . Thus the expected value is and the variance is . The nonzero atom contributes to normalization even though it contributes zero to positive moments. At , conditioning on positive delay is undefined because the conditioning event has probability zero.
The probability mass at an outcome is the probability of its singleton, . It equals the jump of the cumulative distribution function. For a discrete probability distribution these masses form the probability mass function; a continuous probability distribution gives every individual outcome mass zero. Positive probability mass at a point is distinct from the height of a probability density function.
In the right-tail convention, every positive exponential moment is infinite. This is a tail property, not the assertion that the variance or all power moments must be infinite. A heavy-tailed subexponential distribution has the additional property that a sum's far tail is dominated by one large summand.
For nonnegative independent and identically distributed random variables with unbounded support, this is the displayed two-summand tail asymptotic. The probability that the maximum exceeds is , so the sum and maximum have asymptotically the same tail. This is the basic single-large-arrival effect relevant to queue overflow. The concentration-theory sub-exponential random variable uses a separate light-tail convention.
A probability distribution is infinitely divisible if, for every positive integer , it is the distribution of a sum of independent and identically distributed random variables. Their common distribution may depend on . A normal distribution has this property by dividing its mean and variance by ; a Poisson distribution has it by dividing its rate. The unit-time law of a Lévy process is infinitely divisible because it is the sum of its increments on equal time intervals.
A probability law for a future observation conditional on currently available information. A posterior predictive distribution integrates the observation model over the posterior distribution of unknown parameters; a plug-in predictive law instead fixes an estimate of those parameters.
The variance of a predictive distribution quantifies spread of a future quantity conditional on the observed data and model assumptions. For a noisy future observation with fresh independent noise of variance , it is . It should therefore be distinguished from the latent-function posterior variance.
A probability distribution is non-degenerate when it is not a point mass. This condition excludes constant limits in limit theorems and in the maximum domain of attraction of a distribution function.
For a probability measure on a topological space, its support consists of the points whose every open neighborhood has positive probability. For a continuous effort distribution supported on an interval, every open subinterval of that interval has positive probability.
A probability mass function has full support on a specified finite alphabet if for every symbol in that alphabet. This is relative to the chosen alphabet: deleting zero-probability symbols produces a smaller alphabet on which the same law has full support. In a weighted prefix code problem, full support makes every shortening of a retained codeword strictly reduce expected codeword length. Without it, a minimum-cost code tree may contain redundant zero-weight branches.
An effort support is the support of a probability distribution used to randomize effort in a contest. The all-pay indifference equation with random entry determines this support together with its distribution function.
For a real random variable with mean , finite positive variance , and finite fourth moment, kurtosis is the fourth central moment divided by the square of the variance:The standard score measures distance from the mean in standard deviations. Its fourth power gives a value ten standard deviations away a weight inside the expected value. Thus a small probability mass far from the mean can strongly affect kurtosis. It is useful for describing the contribution of extreme standard scores, but does not by itself describe the height or shape of a probability density function near its peak.[ref]
Kurtosis as Peakedness, 1905 – 2014. R.I.P. by Peter H. Westfall. §2, Terminology, definition of κ; §4, counterexamples with different peaks; §5, central and tail contributions
The normal distribution has kurtosis . A random scale can increase kurtosis even when the conditional distribution is normal. A constant random variable has zero variance, so this ratio is undefined. If the variance is finite and positive but the fourth central moment is infinite, the ratio can be written in an extended sense; it is not a finite kurtosis. If the variance itself is infinite or the mean is undefined, the displayed normalization is unavailable.
Excess kurtosis subtracts from kurtosis, making the normal distribution baseline zero. The non-excess convention is sometimes called raw kurtosis; this still uses a fourth central moment, not the uncentered fourth moment . Software may report either kurtosis or excess kurtosis, so the convention must be stated.[ref]
1.3.5.11. Measures of Skewness and Kurtosis. §1.3.5.11, Alternative Definition of Kurtosis, normal baseline and software convention warning
For a standard normal distribution, the moment-generating function of a standard normal variable gives , hence excess kurtosis zero. For a continuous uniform distribution on , the mean is zero, the variance is one, and direct integration givesThe rare-outlier three-point distribution can instead have kurtosis and excess kurtosis with mean zero and variance one. These are calculated properties of specified probability distributions, rather than a measured statistic.
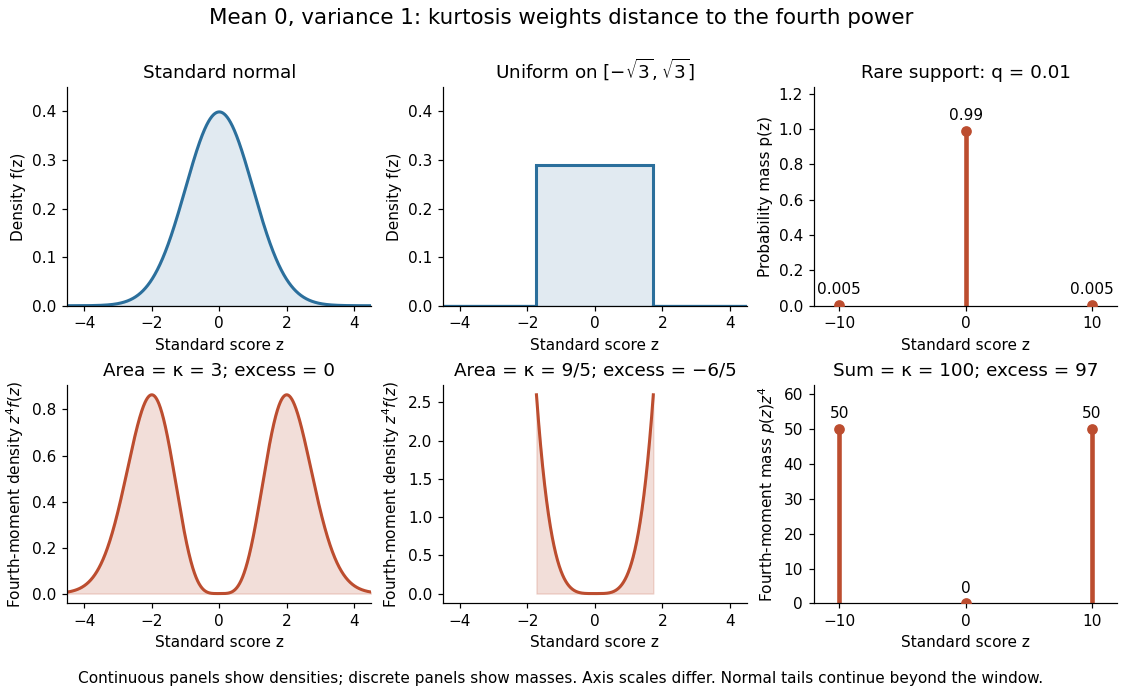
Kurtosis comparison for a standard normal distribution, a continuous uniform distribution, and a rare-outlier three-point distribution
. The upper panels show probability density functions or a probability mass function; the lower panels show their contributions to the fourth central moment. All three probability distributions have mean zero and variance one. Areas in the continuous panels and sums in the discrete panels give kurtosis. The standard normal distribution continues beyond the displayed window; density and mass heights have different meanings. Details.For , put probability mass at zero and at each of and . This symmetric probability distribution has mean zero. Its second and fourth moments are both , because the nonzero outcomes have square and fourth power equal to one:For the kurtosis is ; for it is . In the latter case of the probability mass is at zero, yet all of the fourth central moment comes from the remaining . The standard score takes values and , with variance one. Each nonzero outcome contributesto kurtosis. At , the two rare outcomes are ten standard deviations from the mean, and their contributions are .
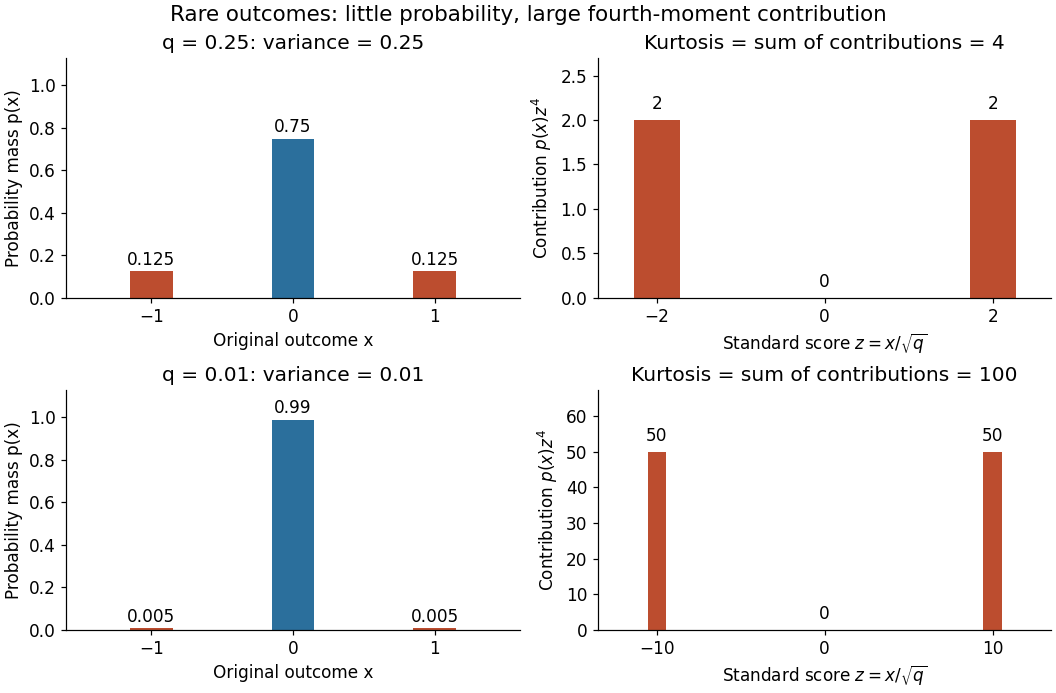
Every member has finite support of a probability distribution, so all its moments are finite. Nevertheless, kurtosis becomes arbitrarily large as approaches zero: high kurtosis does not require an unbounded support of a probability distribution or a heavy-tailed distribution. At the variance vanishes and kurtosis is undefined. At this discrete probability distribution even has the normal distribution value and excess kurtosis zero, so those values do not establish a normal distribution.
Changing units or shifting the origin preserves kurtosis. For real constants and , the mean of is , its variance is , and its fourth central moment is . The factors cancel in the ratio, even for negative . Hence excess kurtosis is also unchanged. For example, and have the same kurtosis, although their means and variances differ. The case produces zero variance and is excluded.
For a standard score and , split kurtosis into the contribution from within standard deviations of the mean and the contribution from outside:The indicator function selects the central outcomes. The bound follows directly from there. Thus : when kurtosis is large, any fixed central range contributes a small fraction. This is a precise reason to emphasize extreme standard scores rather than peak height.[ref]
Kurtosis as Peakedness, 1905 – 2014. R.I.P. by Peter H. Westfall. §5, Why Tails Mostly Determine Kurtosis, inequality (1) and following fixed-h argument
For the rare-outlier three-point distribution with , and . At the other endpoint , all probability mass lies at , so : central dominance is possible when kurtosis is small. More generally, the Cauchy-Schwarz inequality gives ; the equally weighted outcomes attain this minimum.
For a positive random variable with finite nonzero expected value , its integrated tail law has density on . The tail integral formula for moments normalizes it. For its exponential transform is , with extended-value interpretation when needed.
A mixture distribution first chooses a component with nonnegative mixture weights summing to one, then samples from its law . Consequently , and any finite moment-generating function is the same weighted sum of the component transforms. A component may be a Dirac measure, so a mixture may have both discrete and continuous parts.
A Gaussian mixture distribution is a weighted sum of normal distribution densities, with nonnegative weights summing to one. It need not itself be a normal distribution: components with different means and variances can produce skewness or several modes. Its raw moments are weighted sums of the component moments.
The displayed mixture distribution combines a Standard Cauchy distribution and a symmetric law whose magnitude has cumulative distribution function for . Use independent uniforms : if , return ; otherwise return a fair independent sign times . The magnitude density is and splitting its mass equally between signs gives . An alternative rejection sampling proposal is standard Cauchy, with envelope constant , because .
A finite mixture distribution of exponential distributions with rates and nonnegative weights summing to one. Its expected value is and its moment-generating function is on the common finite domain. The mixture chooses one component for each observation; it is not a sum of independent exponential variables.
A probability distribution is nonarithmetic when it is not concentrated on for any . Every law with a probability density is nonarithmetic. This hypothesis removes lattice oscillations from the key renewal theorem.
The right endpoint of a distribution with distribution function is , possibly infinite. The survival function is positive below .
The joint probability distribution of random variables is the probability distribution of the random vector . It records both the marginal distributions and their dependence.
A family of random variables is exchangeable if its joint probability distribution is unchanged by finite permutations of its coordinates. Independent and identically distributed random variables are exchangeable, but exchangeable random variables need not be independent random variables.
For an infinite sequence of real exchangeable random variables, conditional on its invariant sigma-algebra of an exchangeable sequence, the coordinates are independent and identically distributed. In particular, for Borel sets ,Here is the core proof. Let denote invariance under permutations of coordinates . Symmetrization as conditional expectation identifies the empirical average of each indicator with its conditional expectation on . The reverse martingale convergence theorem gives its limit conditional on . Multiplying the averages sums over all ordered coordinate tuples, including repetitions. Symmetrization of the product itself sums over the distinct tuples. The fraction of repeated tuples is at most , so these bounded averages have the same limit. This proves the displayed factorization. Permutation invariance also makes the individual conditional laws identical. A regular conditional distribution on the real line packages that common law as a random probability measure, giving the equivalent mixture-of-iid formulation.
On the coordinate product space of a sequence, the invariant sigma-algebra consists of measurable events unchanged by every finite permutation of coordinates. Its definition is pointwise and does not depend on the probability law. An exchangeable law makes each such permutation measure preserving. Events in the tail sigma-algebra are invariant because any finite permutation fixes every sufficiently late coordinate. Conversely, exchangeable invariant events are tail events modulo null sets.
For a real sequence of exchangeable random variables, every event in its invariant sigma-algebra of an exchangeable sequence agrees almost surely with an event of its tail sigma-algebra. Put . Approximate in by its conditional expectation on the first coordinates. Swap that block with the next coordinates. Invariance of and the law shows that the conditional expectation on the second block is an equally good approximation. It is measurable with respect to the tail after index . The L1 contraction of conditional expectation then bounds by twice the approximation error. The reverse martingale convergence theorem gives almost surely. Thresholding the latter at supplies the required tail event. Together with the reverse inclusion, the two sigma-algebras have identical probability completions.
Let take integer values with probabilities , and let be an independent centered normal distribution with positive standard deviation . Conditioning on gives the probability density function of their sum as , where is the normal density. Nonnegativity and Tonelli's theorem show that this density integrates to one. For small , isolated atoms become narrow smooth peaks with their original probability masses.
For each fixed real , dominated convergence givessince almost surely and is bounded. Thus every fixed integer-valued distribution acquires a Gaussian central profile on this expanding scale, without any moment assumption on . This is not a claim about uniform relative error in the tails or about finite moments. For example, if for and , the expectation of is infinite. Since , the triangle inequality forces too. Symmetry then gives equal infinite positive and negative first moments, so there is no ordinary mean. The second moment is also infinite. A Gaussian-looking center can therefore coexist with a heavy-tailed distribution.
Let have the Standard Cauchy distribution and let , independently, have the uniform distribution on , where . The convolution of probability densities gives the probability density of asThis is an even function. Its derivative isso its unique mode is zero. Its tails satisfy as : multiplying the integral by makes the integrand converge uniformly to on the bounded interval . Consequently both positive and negative parts of the first moment diverge, so its expected value does not exist. The symmetric Cauchy principal value of that moment is zero, which is a different assertion. Adding a bounded independent displacement smooths the probability density without removing the divergent first moment of the Cauchy distribution.
For a taxi starting at any vertex of a rectangle with side lengths , a uniform pickup vertex gives approach-distance law uniform on . Conditional on that pickup, a uniform distinct destination gives passenger-distance law uniform on , independent of the pickup vertex. Hence the two distance variables are independent despite sharing that vertex. Their convolution has twelve equally likely pairs. Its mean is and its variance is . Repeated numerical sums combine their multiplicities when some distances coincide.
A marginal distribution is the distribution of a selected coordinate or subvector of a random vector, obtained from the joint distribution by integrating or summing over the remaining coordinates.
Marginalization sums or integrates a joint probability distribution over unwanted coordinates to obtain a marginal distribution.
A marginal density is a probability density function for one component of a joint probability distribution. Integrating the joint probability density over the other coordinates gives it; for two components, .
A real probability distribution is symmetric about when and have the same distribution. A centered normal distribution is symmetric about zero.
A probability distribution on a vector space is centrally symmetric about zero when and have the same distribution. Independent observations from such a distribution are jointly invariant under coordinatewise sign changes.
On with Lebesgue measure, the functions , , are independent symmetric Rademacher random variables. Every prescribed pattern for the first functions occupies a dyadic interval of measure . Their closed span in is isomorphic to the l2 sequence space by the Khintchine inequality.
A Rademacher sum is a linear combination of independent Rademacher random variables, with scalar or normed-space-valued coefficients. Its moments are controlled by the Khintchine inequality in the scalar case and the Kahane-Khintchine inequality in a general normed vector space.
For independent Rademacher random variables, this series converges absolutely on every sign sequence and has the uniform distribution on . Its first terms are uniform on the midpoints of equal subintervals of , giving weak convergence of probability measures by Riemann sums. The remaining tail has absolute value at most , and its mean square is by independence. Thus convergence is also almost surely and in .
On the Boolean hypercube with uniform measure, each coordinate is a Rademacher random variable. Products of these sign coordinate functions are Walsh characters. This use of Bernoulli function is distinct from the fluid-mechanical Bernoulli function.
For independent Rademacher random variables and , this bound holds for . The moment-generating function satisfies , with strict inequality for a nonzero vector and . Applying the exponential Markov bound to both tails and then the union bound proves a strict failure bound; a zero vector has failure probability zero. At , the success probability is strictly positive, ensuring a sign vector with all linear forms below that threshold.
A truncated distribution is a conditional probability distribution obtained by restricting a random variable to a specified subset of its original support and renormalizing.
Condition an exponential distribution of rate on falling below . Normalizing its probability density function gives the displayed density. Integration gives expectation . As , the density tends to the uniform distribution on and the expectation tends to .
// Target: probability-and-statistics.bigb
For a positive continuous density with strictly increasing cumulative distribution function , observations from its upper-truncated law have likelihood on . Holding fixed, decreasing toward increases the likelihood; taking a supremum over preserves nonincreasing dependence on . Provided the nuisance fit is finite, the usual closed-support endpoint estimate is . With the literal open support , only a limiting supremum need exist. A sample maximum is not a validated bound for future observations, and support depending on a parameter prevents automatic application of Wilks theorem.
For a nonnegative integer claim count with , the conditional law given has masses for . Its probability generating function is . Truncation at zero is meaningful only when the positive-count event has positive probability.
Let have probability mass function satisfying for . Let independent positive integer claim sizes have probability mass function , independently of . The aggregate probability mass function satisfies the displayed recursion, with . To prove it, write for the count, severity and aggregate probability generating functions. The count recurrence gives . Since , the chain rule gives . Comparing coefficients of gives the recursion. The forcing term distinguishes this algorithm from the usual Panjer recursion. For a zero-truncated Poisson distribution with parameter , take , and .
A truncated normal distribution is a normal distribution conditioned to lie in a specified subset of the real line. Its density is the original Gaussian density divided by the probability of the retained set.
For with standard normal distribution, , and , integrate over . The identity gives the displayed expectation of the positive part. This is useful for option pricing when a financial payoff is the positive part of a normal random variable, including a log-call option. At the formula is interpreted by its limit, .
To draw restricted to a positive value, let and return for uniform . For restriction to a negative value use . These are inverse transform sampling constructions. Repeatedly drawing an untruncated normal until its sign agrees is also exact, but inefficient for rare signs.
The beta distribution is an absolutely continuous probability distribution for a random variable between zero and one. It can describe uncertainty about a probability, such as an unknown coin's chance of heads. For any real , its probability density function isand zero outside . The normalizer is the Euler beta function, related to the gamma function by the beta-gamma identity:Thus the probability density function integrates to one. [ref].
The endpoint behavior explains why the restrictions are exactly : near zero the probability density function behaves like a constant times , and near one like a constant times . These improper integrals converge for positive parameters, even when the probability density function diverges at zero for or at one for . There is no probability mass at either endpoint: . A probability density function's height is not a probability; an interval's probability is the area under it.
Some useful examples of the beta distribution are:
- is the uniform distribution on , with probability density function .
- has probability density function : values near one half are favored, and it is a symmetric probability distribution about one half.
- has probability density function . Its mean is and its variance is ; most of its area lies toward the lower end.
- is the arcsine distribution, with probability density function . It favors values near both endpoints despite having mean ; its variance is .
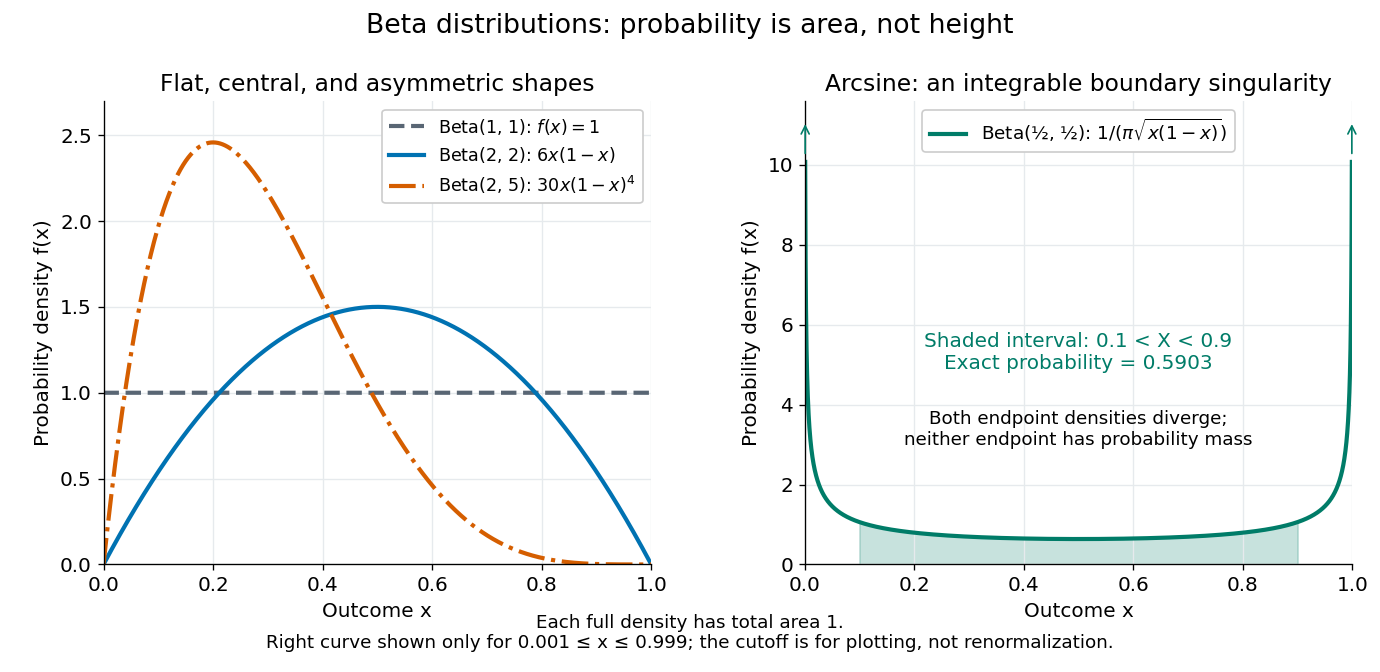
The arcsine distribution curve is plotted only for ; its finite plotted ends do not represent finite endpoint values of the probability density function. Using the inverse sine, the shaded central interval has exact probability , calculated analytically rather than by treating the cropped curve as normalized.
To separate location from spread, write and . The mean and variance of the beta distribution areThe mean specifies the balance between the parameters; their sum controls concentration about that mean. Multiplying both parameters by the same positive number preserves the mean and changes the variance. Larger puts more area near and makes the probability density function taller there; the total area stays one. Small allows much greater spread, sometimes favoring the endpoints rather than the mean itself.
For example, keeping mean and taking gives the beta distributions , , and . Their variances are , , and , respectively. Parameters need not be integers.
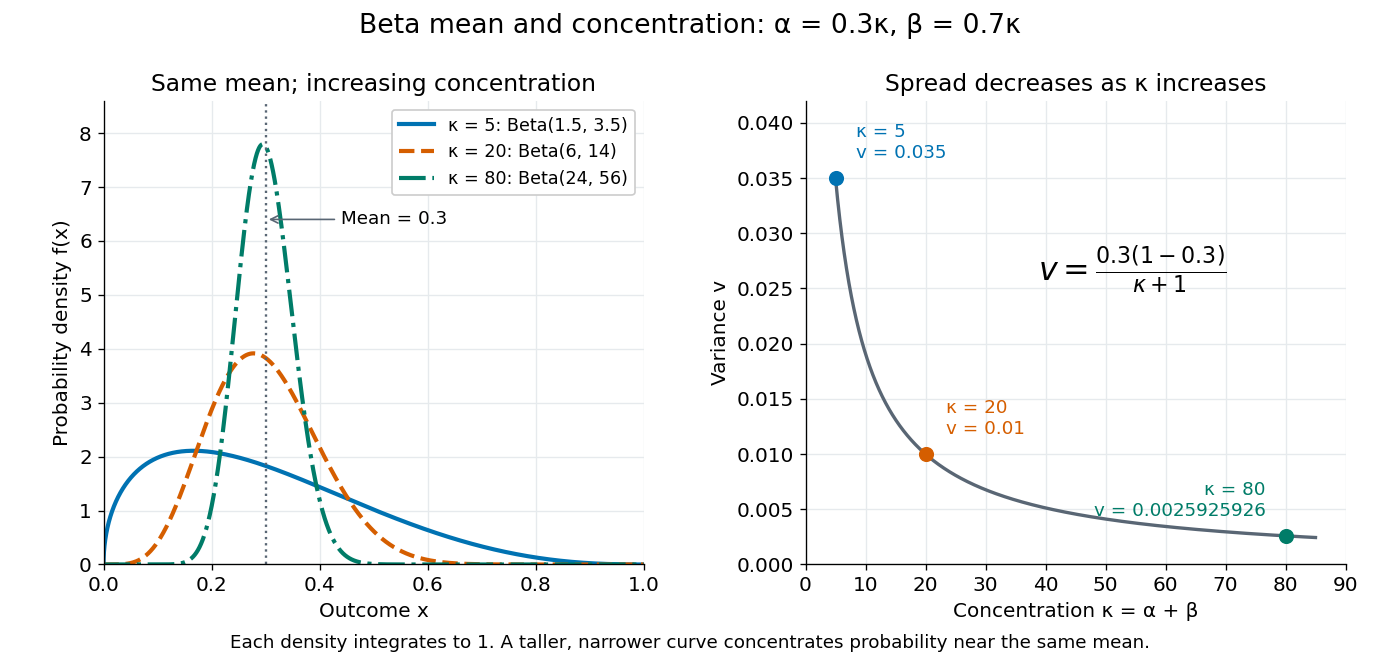
The formulas follow from two short moment calculations. Multiplying the probability density function by or increases the first parameter of the Euler beta function:Apply the Gamma function recurrence to the beta-gamma identity, then subtract from to obtain the variance.
The beta distribution is especially convenient as a prior distribution for the unknown success probability of Bernoulli trials. The Beta-binomial conjugacy says that successes and failures update a prior distribution to a posterior distribution . For example, suppose a coin has prior distribution and we observe eight heads and two tails. Its posterior distribution is then , with posterior mean . [ref]
https://ocw.mit.edu/courses/18-05-introduction-to-probability-and-statistics-spring-2022/mit18_05_s22_class15-prep.pdf. MIT 18.05, Reading 15: beta priors and conjugate updating
.For with positive parameters, and real , , multiply its density by . The resulting integral is a beta function with shifted parameters, henceThe restrictions on the powers are exactly the endpoint-integrability conditions. This includes ordinary moments, reciprocal moments when they exist, and quantities involving both the occupied fraction and remaining fraction . In particular, gives .[ref]
For , direct integration of its probability density function gives the displayed tail for . Increasing strictly decreases every such tail probability, and converges in probability to zero as . Its mean is and its variance is ; both decrease for . For the variance, logarithmic differentiation gives in that range.
After successes in conditionally independent Bernoulli trials, Beta-binomial conjugacy gives posterior mean . Its derivative with respect to is negative, while the weight assigned to the prior mean is increasing for .
For an independent statistical sample from the beta distribution with parameters , , the probability density function is on . Its raw moments are for , by direct integration. Consequently the method of moments gives , whereas the maximum-likelihood estimator is .
The second formula follows by setting the score function to zero; its derivative is negative. Also has an exponential distribution of rate , since . The central limit theorem and delta method giveThus the asymptotic relative efficiency of relative to is . The transformed sum has a gamma distribution of shape and rate , which also gives for and for .
Moment matching for a beta prior turns a desired mean and variance for an unknown probability into the parameters of a beta distribution prior. Choose andSolving the beta distribution mean and variance identities givesThe strict upper bound on the variance makes , so both parameters are positive. Substitution gives mean and variance exactly. A smaller specified variance at fixed mean produces a more concentrated prior distribution.
For example, a desired prior mean and variance give , hence the beta distribution prior . With the same mean and variance , the calculation instead gives and the broader beta distribution prior . Both appear in the concentration diagram above.
The excluded boundary cases have clear meanings. Zero variance would require with certainty, not a beta distribution with finite positive parameters. At the other boundary, any random variable satisfies , hence variance at most ; equality requires to take only the endpoint values zero and one. This is a Bernoulli distribution, not a beta distribution. Thus cannot be matched by positive finite parameters, and or is also excluded.
After observing Bernoulli trials, the Beta-binomial conjugacy makes the posterior mean a weighted average of the prior mean and observed binomial proportion :This formula gives a precise interpretation as the prior's weight relative to the sample size in this posterior mean. It does not require fictitious observed counts: the beta distribution parameters can be any positive real numbers. For the eight-head, two-tail example above, and , so the posterior mean is .
// Target: statistical-inference.bigb
For positive integers , the th order statistic from independent uniform distributions on has Beta distribution . Selecting the observations below and above a value gives its probability density function proportional to , with normalizing factor .
Independent gamma distributions and with a common rate yield a Beta distribution . The change of variables , has Jacobian determinant , and factors the joint probability density function into a Beta distribution density in and a gamma distribution density in . In particular, independent chi-squared distributions with and degrees of freedom give the required ratio.
The cumulative distribution function of a real random variable isIt records the probability accumulated up to a threshold. It is a nondecreasing function and is right-continuous; its limits are zero at and one at . These properties follow from ordered threshold events, continuity from above of a measure, and continuity from below of a measure. A cumulative distribution function determines the entire probability distribution on the real line. [ref].
For ,where is its left-hand limit. The second formula measures a jump. Thus ; changing an endpoint is harmless only when its point probability is zero.
For the finite example under probability distribution, is below zero, on , on , and on . In particular , but , so the jump gives . For the density example, on , and its increase from to is .
When an absolutely continuous probability distribution has probability density function , its cumulative distribution function is and almost everywhere. A continuous cumulative distribution function by itself does not guarantee such a density: the Cantor distribution is an important exception.
If a random variable takes values in , its cumulative distribution function satisfiesIndeed for every outcome. Taking expected values and using Tonelli's theorem proves the formula, including when the probability distribution has atoms. For a probability density function , the same proof reverses the order in . Thus , restricted to , is a probability density function whenever . The reflected construction using has normalising constant and is closely related to an integrated tail distribution.
For , every difference quotient at is nonnegative and bounded by . The spherical derivative of a singular measure vanishes, so the two-sided derivative is zero Lebesgue almost everywhere. A singular distribution function need not be constant: differentiation almost everywhere does not recover increments without absolute continuity of a function of the function.
The Kolmogorov distance between two probability distributions with cumulative distribution functions is .
If a cumulative distribution function is constant between consecutive lattice points spaced by near zero, then its Kolmogorov distance from the standard normal distribution function is at least half the increase of that function across one such interval. This gives a lower bound of order .
If has a continuous cumulative distribution function , then has the uniform distribution on . Combined with inverse transform sampling, this constructs the monotone rearrangement to a target with quantile function .
For correct continuous conditional forecasts, the conditional probability integral transform is uniform given the entire past. Iterating conditional probabilities makes the transformed sequence independent and uniform. Uniformity and serial checks assess absolute predictive calibration using only the forecast distributions and observations.
If distribution functions converge pointwise to a continuous distribution function , then the convergence is uniform. Choose finitely many points whose successive -increments and two tails are small, then use monotonicity to squeeze between its values at adjacent points.
The empirical distribution function counts the fraction of observations at or below a threshold. For a statistical sample of real observations , defineEach indicator function contributes one exactly when its observation is counted. Equivalently, , where the empirical measure assigns probability mass to each observation, including repeated observations.[ref]
Choose the illustrative statistical sample . Its empirical distribution function isFor example, counts both observations equal to , , and . There is no observation at , so there is no jump there. The five observations produce only four distinct jump locations.
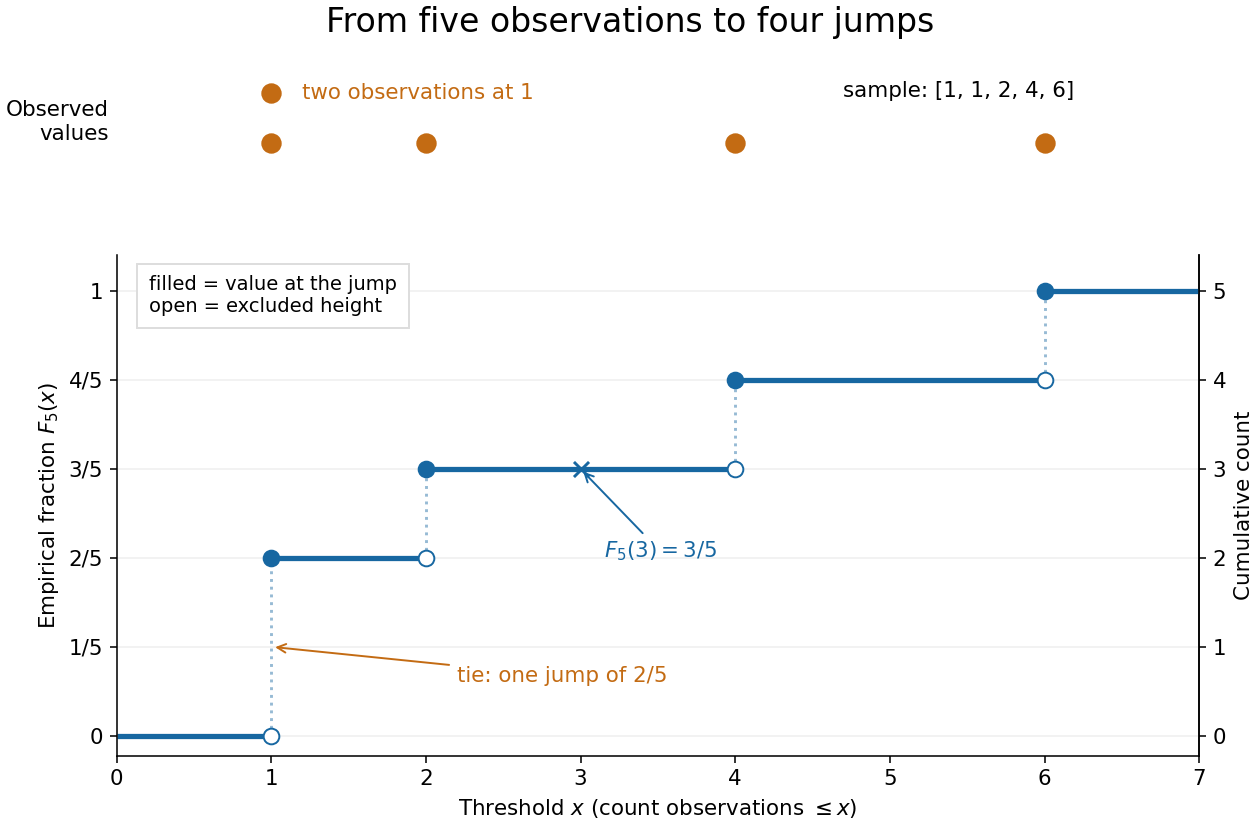
The convention makes the empirical distribution function right-continuous: once a threshold reaches an observation, that observation remains counted immediately to its right. For a finite statistical sample, the count is constant from any up to the next larger observed value, proving right continuity. Its left-hand limit counts observations strictly below , soA value occurring times causes one jump of size . At the jump is ; at , , and each jump is . All jumps sum to one. Thus the empirical distribution function is a nondecreasing step function with limits zero and one, and is itself a valid cumulative distribution function.
This turns many questions about data into simple cumulative distribution function operations. The observed fraction in is : for it is , counting and but excluding both s. Including the left endpoint gives . A sample quantile reads the same staircase in reverse: the smallest threshold reaching is . Unlike a histogram, this representation requires no choice of bins; its jumps retain every observation and its multiplicity.
The exact description of a finite statistical sample must be distinguished from a statistical model for how it was obtained. The empirical distribution function is defined for any finite list, with no independence assumption. Once the list is observed, its counts are fixed. For statistical inference, one often models as independent and identically distributed random variables with an unknown population cumulative distribution function . Then describes the sampling law, while varies across repeated statistical samples. The value is an observed fraction and an estimate of ; it does not establish that the population probability is . Even when is continuous, every finite is discrete.
For any threshold fixed before sampling, the indicator functions are independent Bernoulli random variables with success probability . Therefore the count has a binomial distribution andThe expected value follows by adding the expected values of the indicator functions; the variance follows by adding their variances using independence and dividing by . Thus is an unbiased estimator of at a fixed threshold. Controlling the error at every threshold at once requires more than a fixed-threshold calculation: the DKW inequality supplies such control, and the Glivenko-Cantelli theorem describes its uniform convergence almost surely as grows.
Comparing with a proposed cumulative distribution function also motivates goodness-of-fit tests, including the Kolmogorov-Smirnov test, the Anderson–Darling test, and the Cramér–von Mises criterion. A standard Kolmogorov-Smirnov test calibration assumes a fully specified continuous population law; fitting its statistical parameters from the same statistical sample changes that calibration.[ref]
1.3.5.16. Kolmogorov-Smirnov Goodness-of-Fit Test. NIST and SEMATECH e-Handbook of Statistical Methods; Characteristics and Limitations, items 1 and 3; Definition, test statistic and fully specified distribution requirement
For independent and identically distributed real random variables with cumulative distribution function , the Dvoretzky-Kiefer-Wolfowitz inequality gives, for every and ,The supremum is the Kolmogorov distance: a single event controls all thresholds simultaneously. The bound holds for discrete, continuous, and mixed probability distributions.[ref]
For one fixed threshold, Hoeffding's inequality gives the same expression as an upper bound on . That fixed-threshold result alone does not justify moving the supremum inside the probability. The DKW inequality is the stronger statement needed for a simultaneous empirical distribution confidence band.
Fix a failure probability and assume an independent and identically distributed statistical sample. A finite-sample confidence band for its population cumulative distribution function isHere is the natural logarithm. The DKW inequality impliesThis is simultaneous coverage over the whole real line, valid at each fixed sample size.[ref]
To obtain the band, solve for the positive . Outside a failure event of probability at most , for every . Since a cumulative distribution function already lies in , clipping the endpoints to this interval preserves the coverage event. The guarantee is at least , and need not equal it.
Choose , giving at least simultaneous coverage under the stated model. For , respectively, the half-widths before clipping areFor the chosen five observations, the band at is , while at it is approximately . At the unclipped band would be , so clipping gives . The broad uncertainty is informative: five observations give a precise description of themselves, but a coarse bound for an unknown population cumulative distribution function.
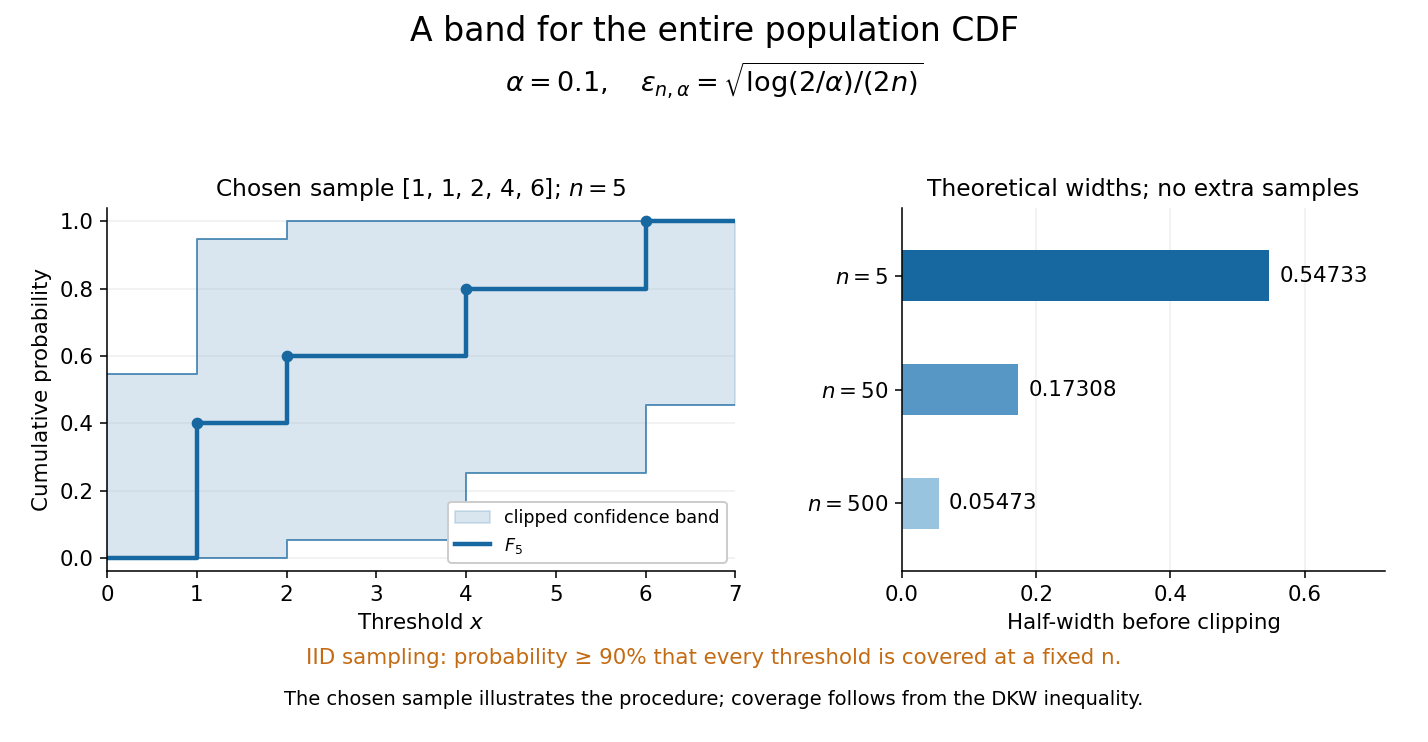
Finite-sample simultaneous uncertainty around an empirical distribution function
. Left: the chosen five observations give and its band clipped to , using . Right: theoretical half-widths for , with no additional samples constructed. The confidence band has coverage at least under independent and identically distributed sampling; the drawing illustrates the procedure and does not establish its coverage. Details.A collection of pointwise confidence intervals only promises coverage separately at each preselected threshold; it does not promise coverage of an entire cumulative distribution function. Here the one simultaneous event permits inspecting any threshold after seeing the data. The probability refers to repeated sampling of the entire statistical sample, with fixed. It does not assign probability to a fixed after observing this particular band, and it is not a prediction interval for a future observation. The displayed comparison gives a guarantee for each fixed separately, not simultaneous validity over all sample sizes or an optional stopping rule. The chosen observations are an illustration; the coverage claim follows from the DKW inequality, not from their appearance or a simulation. Dependence or observations with different sampling laws require another argument.
At fixed , multiplying by divides the half-width by . Conversely, a desired half-width is ensured by , rounded up to an integer. For and , this sufficient sample size is . This makes the confidence band useful for planning how many observations are needed before estimating threshold probabilities to a chosen simultaneous accuracy.
The test rejects for large values of this tail-weighted empirical discrepancy. For a specified continuous null, its standard limiting statistic is , using a Brownian bridge. The reciprocal variance weight gives tail deviations more influence than the Cramér–von Mises criterion. If null parameters are estimated, fitting must be included when computing or simulating its reference law.
This goodness-of-fit criterion integrates the squared difference between the empirical distribution function and a specified continuous null distribution. Under a fully specified null, the probability integral transform makes its law distribution-free; its limiting law is for a Brownian bridge. Parameter fitting changes that calibration.
The empirical distribution process is the centred, scaled empirical distribution function of an independent sample with cumulative distribution function . Its mean is zero and its covariance is . This follows by expanding the two indicator averages: different sample indices have zero covariance, while the same index contributes the covariance of the two nested events. The scaling by keeps these covariances independent of .
For an independent sample with cumulative distribution function , the empirical distribution process converges in the supremum norm on to the F-Brownian bridge. The convergence uses outer expectation and inner expectation when finite-sample Borel measurability fails. It is a full function-space theorem, stronger than the Finite-dimensional Brownian bridge limit of an empirical distribution process. No continuity of is required. The continuous mapping theorem gives convergence of the supremum statistic; for continuous , its range contains and the bridge vanishes at zero and one, giving the Kolmogorov-Smirnov theorem. The function-space statement is stated here as a theorem; its tightness assertion is an additional ingredient beyond the finite-dimensional covariance calculation.
For fixed , the vector converges in distribution to , where is a standard Brownian bridge. To prove it, write the vector as times the sum of independent centred bounded indicator vectors. Their covariance matrix is . The multivariate central limit theorem gives a centred multivariate normal distribution with this covariance, exactly the bridge vector. Singular covariance matrices, including endpoint times or repeated values of , cause no problem. This is a finite-dimensional assertion; a full function-space limit additionally requires tightness.
The Cauchy distribution with location and scale has probability density functionThe standard Cauchy distribution has , , characteristic function , and infinite first absolute moment.
The normalized Cauchy distribution densities , , form a convolution semigroup: convolution adds their scale parameters. This follows from the convolution theorem, since their Fourier transforms are proportional to . Consequently an integral equation with a Cauchy kernel can be solved by subtracting scale parameters when the resulting scale is positive.
If and has the continuous uniform distribution on , then has the Cauchy distribution with location zero and scale . The tangent function is strictly increasing on this interval, so its cumulative distribution function isDifferentiating gives the probability density function . The probability of either endpoint is zero, so including endpoints in the uniform interval does not alter this probability distribution. The slow quadratic decay makes the expected value undefined: its positive and negative parts both have infinite integrals. Its second moment is also infinite, so it has no finite standard deviation.
Independent standard Cauchy distribution variables sum to a Cauchy law of scale , so their sample mean has its original distribution for every sample size. This follows by induction using convolution of probability densities. It does not contradict the usual weak law of large numbers, since the Cauchy law has no finite first absolute moment and its expectation is undefined. Symmetry does not turn a divergent expectation into zero.
The absolute value of a centered Cauchy distribution variable with scale has this probability density function. Its positive support and doubled density distinguish it from the two-sided distribution. Its unit-scale case arises as the ratio of two independent, equally scaled half-normal distribution variables.
For independent Brownian motions , the strong law for Brownian motion makes finite almost surely, so bracket localization gives an almost sure limit of the stochastic integral. The arctangent transform of a two-noise affine diffusion and endpoint convergence of a bounded angle diffusion identify its distribution function as . Conditional Gaussianity rules out atoms.
A Cauchy random variable is a random variable having a Cauchy distribution. For a standard Cauchy random variable ,
If are independent standard Cauchy random variables, thenis again standard Cauchy. Indeed, its characteristic function is .
A probability distribution is stable when every linear combination of independent copies has the same distribution up to a location and scale change. The Cauchy distribution is stable with stability parameter one.
A symmetric stable distribution has this characteristic function, with and location . At location zero it is a strictly stable distribution: weighted sums of independent copies have scale factor . The index need not permit a finite mean or variance. The scale in this convention is , so the coefficient of and the scale parameter should not be confused.
For , represent as . The Tonelli theorem applies to the nonnegative integrand. The inner integral in is , leaving . Substitution and the Euler beta function together with the Gamma reflection formula give the result. The bounds at zero and infinity explain exactly the index range.
A probability distribution is strictly stable with index if for every positive integer , for independent copies. Here no centering term is allowed, unlike in the general definition of a stable distribution.
Let have a strictly stable distribution of index , and let be an independent copy. For integers , split a sum of independent copies into blocks of sizes and . Strict stability of each block and of the full sum givesFor any , choose rationals . On the fixed probability space carrying , the left side converges almost surely to . Thus it converges in distribution; since its probability distribution is constant, the limit also has the law of . This proves a self-decomposable distribution with the displayed remainder. The proof does not require any finite moments.
Articles were limited to the first 100 out of 437 total.