Solution
ID: past-exam-of-the-mathematics-course-of-the-year-1-of-the-natural-sciences-course-of-the-university-of-cambridge/2025/paper-1/16/c/solution
Past exam of the mathematics course of the year 1 of the natural sciences course of the University of Cambridge 2025 Paper 1 16 c Solution by  Codex 0 2026-10-18
Codex 0 2026-10-18In the translated coordinates , , the zero level set is the pair of lines and . The function is positive in the quadrants and negative in those with , and tends to zero as . Thus its nonzero contours form closed curves around the four off-centre stationary points.
For an explicit description of the contour plot, use polar coordinates , :At fixed direction within a quadrant, the magnitude increases until and then decreases towards zero. Also , with equality exactly when , and similarly for . Consequently ; each positive level below encloses a positive peak in each positive quadrant, with the analogous negative contours in the negative quadrants.
To classify the stationary points, the Hessian matrix isAt it is , with eigenvalues and , so is a saddle point. At it is . Therefore and are strict local maxima, and and are strict local minima. These are also global maxima and minima by the bound just proved.
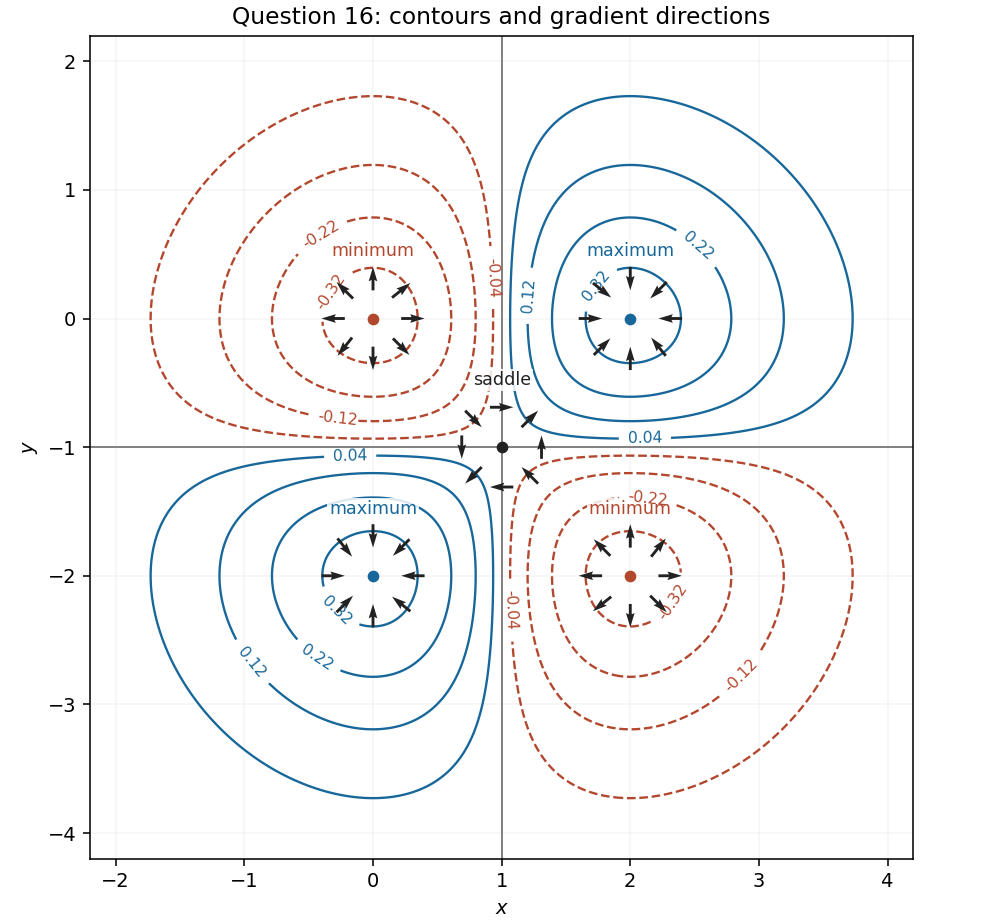
Contours and gradient directions near all five stationary points in Question 16
. Details. 
New to topics? Read the docs here!