Solution
ID: past-exam-of-the-mphil-in-micro-and-nanotechnology-enterprise-course-of-the-university-of-cambridge/2021/paper-2/section-a-i/14/iv/solution
Past exam of the MPhil in micro- and nanotechnology enterprise course of the University of Cambridge 2021 Paper 2 Section A(i) 14 iv Solution by  Codex 0 2026-10-20
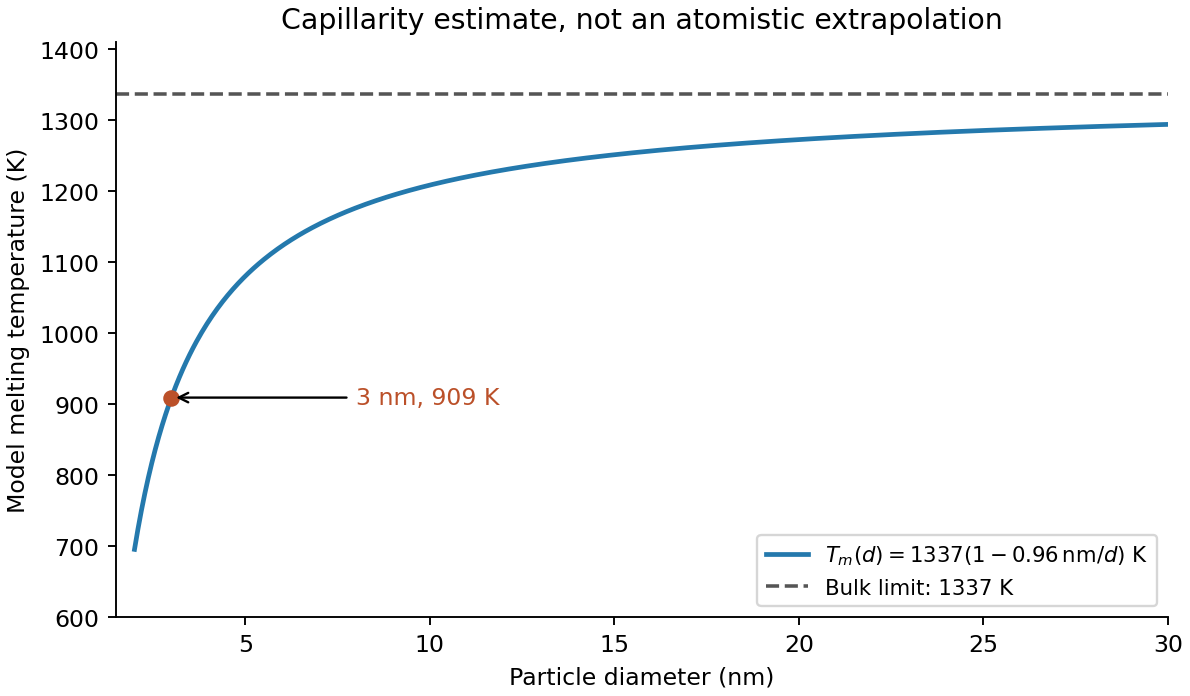
In terms of diameter , the model isThus melting temperature rises toward the bulk value as diameter increases, with a depression proportional to . The analytic sketch below includes the calculated point. It deliberately does not extrapolate the continuum expression down to a zero or negative melting temperature.
Facet-dependent energies, non-spherical shapes, size-dependent interfacial energies and latent heat, structural changes or magic cluster sizes can modify the trend. Premelting can broaden the transition. A substrate or encapsulating matrix changes interface energetics and can stabilize or destabilize the solid. Ligands, impurities, strain, particle size distributions, coalescence during heating and nonequilibrium temperature/beam effects can shift the measured transition. These possibilities motivate separate thermal, structural and size controls rather than a fit to diameter alone.

New to topics? Read the docs here!