
If and , the infectious compartment initially grows. The SIR model equations give its unique later maximum whenBefore this SIR infection peak, ; afterward it is negative because the susceptible compartment keeps shrinking. Substituting into the SIR first integral givesFor the stipulated initial value problem,Thus about of the modelled population belongs to the infectious compartment simultaneously at the SIR infection peak. This is a peak of the infectious compartment, not of incidence, whose flow is . If , the maximum is already at the start and the interior SIR infection peak formula does not apply.
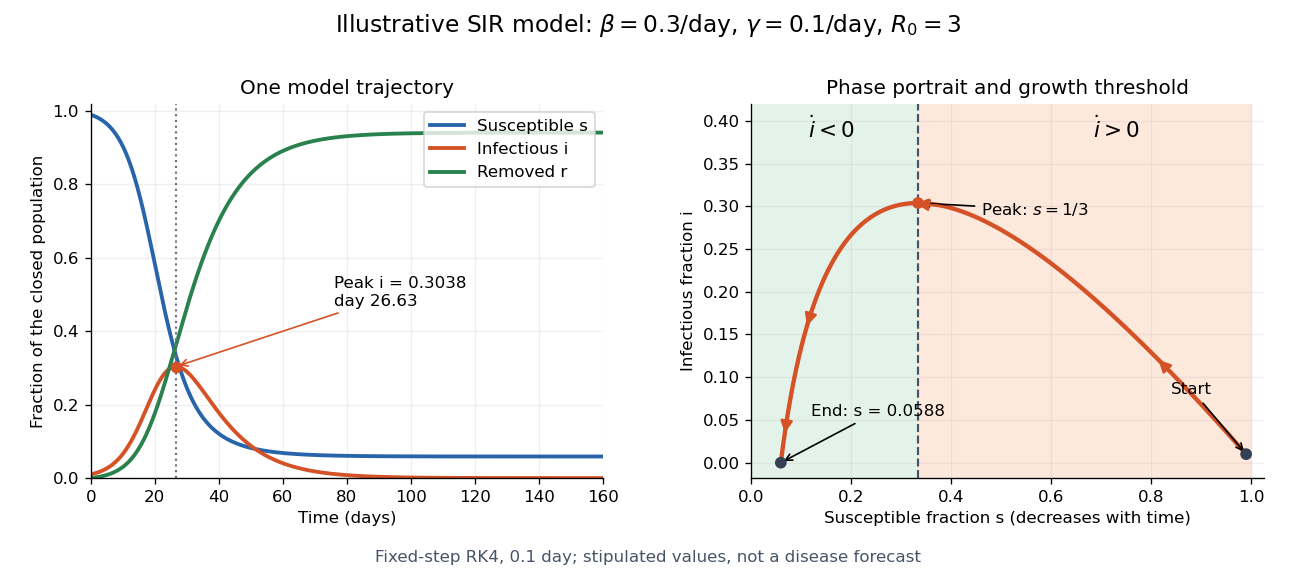

The numerical solution of a differential equation puts the SIR infection peak at about day with , agreeing with the SIR first integral to within . The accompanying generator checks nonnegative fractions and conservation of population without clipping or rescaling. For steps , and day, the largest differences between successive numerical trajectories at shared times are approximately and . Their ratio is , close to the factor expected when a fourth-order Runge-Kutta method's step is halved.
New to topics? Read the docs here!