
This is the easiest one to do iteratively:
- pop and visit
- push right to stack
- push left to stack
This is the hardest one to do iteratively.
PNG reference implementation. Ahh, if feels good to have a dominating open source reference implementation.
Demo of using it by Ciro Santilli: stackoverflow.com/questions/1362945/how-to-decode-a-png-image-to-raw-bytes-from-c-code-with-libpng/36399711#36399711


Also known as: Quantitative PCR (qPCR).
This describes one possible concentration detection method with fluorescent molecules that only become fluorescent when the DNA is double stranded (SYBR Green)
Polymerase Chain Reaction (PCR) - Quantitative PCR (qPCR) by Applied Biological Materials (2016)
Source. This allows you to predict the exact initial concentration by extrapolating the exponential curve backwards.
Isothermal means "at fixed temperature".
This is to contrast with the more well established polymerase chain reaction, which requires heating and cooling the sample several times.
E.g. showing live data from a scientific instrument! TODO:
- superuser.com/questions/825588/what-is-the-easiest-way-of-visualizing-data-from-stdout-as-a-graph
- unix.stackexchange.com/questions/190337/how-can-i-make-a-graphical-plot-of-a-sequence-of-numbers-from-the-standard-input
- stackoverflow.com/questions/44470965/how-can-you-watch-gnuplot-realtime-data-plots-as-a-live-graph-with-automatic-up
- stackoverflow.com/questions/14074790/plotting-a-string-of-csv-data-in-realtime-using-linux
- stackoverflow.com/questions/11874767/how-do-i-plot-in-real-time-in-a-while-loop-using-matplotlib
Tends to be Ciro's pick if gnuplot can't handle the use case, or if the project is really really serious.
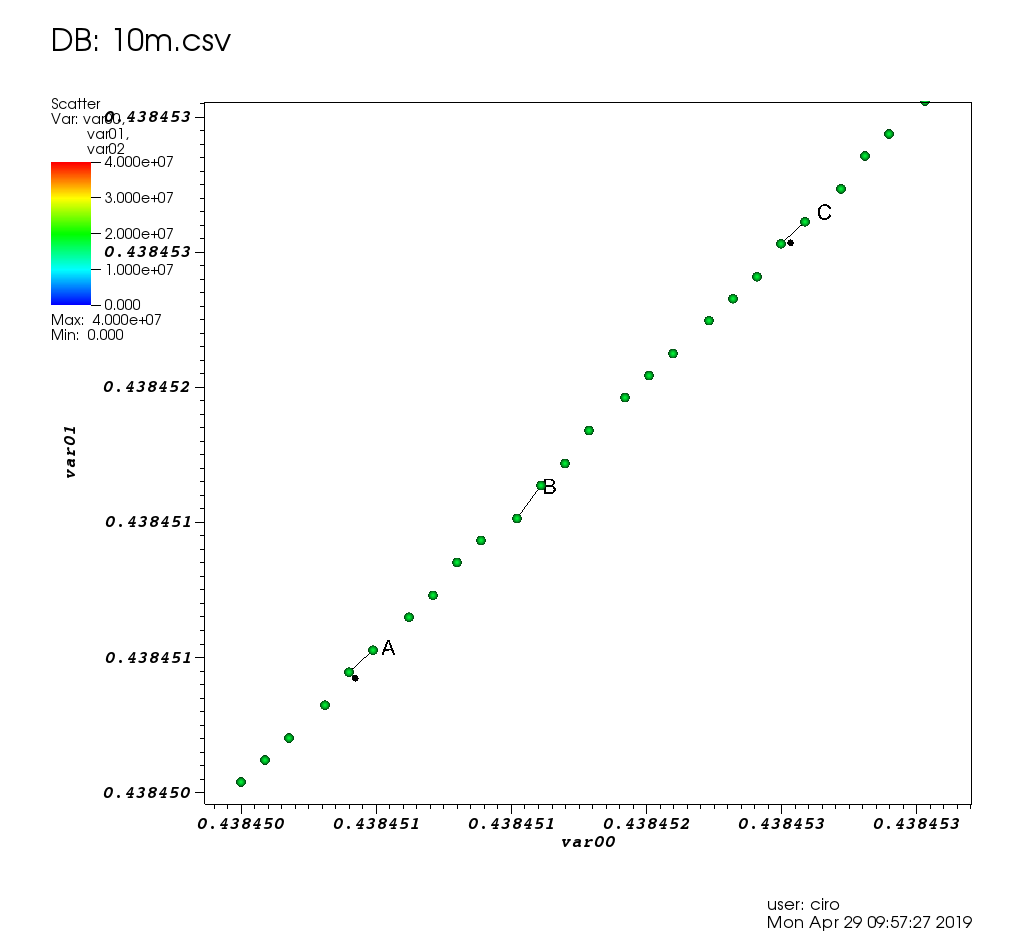
Couldn't handle exploration of large datasets though: Survey of open source interactive plotting software with a 10 million point scatter plot benchmark by Ciro Santilli
Examples:
- matplotlib/hello.py
- matplotlib/educational2d.py
- matplotlib/axis.py
- matplotlib/label.py
- Line style
- Subplots
- matplotlib/two_lines.py
- Data from files
- Specialized
Tends to be Ciro Santilli's first attempt for quick and dirty graphing: github.com/cirosantilli/gnuplot-cheat.
When it doesn't, you Google for an hours, and then you give up in frustration, and fall back to Matplotlib.
Couldn't handle exploration of large datasets though: Survey of open source interactive plotting software with a 10 million point scatter plot benchmark by Ciro Santilli
Only many many years after playing it, after Ciro started getting more interested, did he learn that it was actually an adaptation of the Chinese mega-classic Water Margin.
"Suikoden" is the actual Japenese transliteration for the Chinese name of the original Water Margin novel.
The game puts great emphasis on the concept of the 108 Stars of Destiny, which never left Ciro's mind: making 108 allies, the main collectible of the game, allows you to make a more powerful alliance, and unlock better endings.
There are unlisted articles, also show them or only show them.