A gear face load factor quantifies the effect of nonuniform load across the engaged gear face width. For the contact-load convention in ISO 6336-1:2006, compares maximum line-load intensity with the mean intensity over the stated width:Here is the total load represented by that distribution and is its evaluation width. A uniform distribution gives1; an edge-concentrated distribution gives a larger value. The numerator and denominator must refer to the same load convention and operating condition.[ref]
For an original illustrative distribution over ,total load is1000N, mean line load is50N/mm and maximum line load is80N/mm. Thus . A uniform distribution with the same width and total load gives1. The gear contact pattern can cover the whole width in both cases.
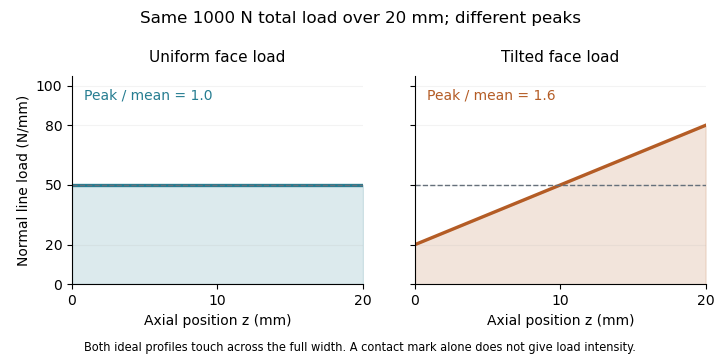

For ideal elastic line contact at fixed geometry and material, Hertzian contact pressure scales with the square root of line load. The corresponding gear contact-stress load factor is therefore in this simplified comparison. Multiplying the contact pressure itself by1.6 would confuse a load-intensity ratio with a stress ratio. This scaling does not replace a complete gear-rating calculation.
The manufacturer's treatment connects face-load assessment to shaft-support placement, shaft stiffness and loaded contact quality.[ref] A value inferred from a toy line-load profile is consequently useful for understanding the factor, while a real design must obtain the relevant distribution or factor from a method appropriate to its geometry and load state.
The gear contact-stress load factor is the multiplier associated with the face-load term in a contact-stress calculation where Hertzian contact pressure scales with the square root of local line load. It distinguishes a stress ratio from the underlying gear face load factor. The historical definition of compares maximum line-load intensity with the mean over the evaluation width.[ref]
For ideal elastic line contact, hold the effective geometry and material fixed. Write the peak pressure aswhere is load per contact length, the effective elastic modulus and the effective radius. If the largest line load is , division by the pressure calculated from the mean line load givesThe square root follows from the pressure model; it is not a second independent multiplier on the load.
For an original example, a face-load ratio gives a stress multiplier . A mean-line-load reference pressure would become under these assumptions. Multiplying pressure directly by would instead give and count the load ratio as though it were a stress ratio. Increasing effective line load fourfold doubles this model pressure.
Small relative uncertainties also scale differently:Thus a small relative change in produces about a relative change in its square root to first order. This sensitivity concerns that term alone; uncertainties in material, geometry and the reference load remain.
A local stress scaling does not predict gear surface pitting life on its own. Contact position, curvature, load history and material response matter. A primary NASA analysis explicitly combined varying tooth loads and contact geometry with a fatigue-life model.[ref]
Predicted Effect of Dynamic Load on Pitting Fatigue Life for Low-Contact-Ratio Spur Gears by David G. Lewicki. Summary, printed p. 1; Analysis, tooth-contact intervals and varying curvature/load
A real rating must keep all factors and load conventions consistent with the chosen method. Articles by others on the same topic
There are currently no matching articles.