Gear face width describes the width of the toothed portion. For a cylindrical spur gear or helical gear, it is measured parallel to the rotation axis, rather than along the slanting tooth trace. A projecting hub need not be part of the toothed width. Manufacturer drawings distinguish face width, hub width and total length as separate dimensions.[ref]
KHK Gear Nomenclature. KHK SSG-R catalog dimensional table: face width E, hub width F and total length G
The available width of one gear is not necessarily the gear effective face width of a pair. For two aligned cylindrical gears with equal width and relative axial offset , a simple interval-overlap model givesAn original pair offset by has only of common axial extent. If a hypothetical normal load were uniformly spread across that extent, mean load per axial width would rise from to . This is bookkeeping for an ideal uniform load, not a tooth-strength prediction. Actual gear face load distribution also depends on alignment and deformation.
For helical gears, width also enters gear overlap ratio:With gear normal module and gear helix angle , reducing engaged width from to reduces ideal overlap from to . The overall gear ratio is unchanged. Width therefore affects engagement and loading even when tooth counts and shaft speeds remain the same.[ref]
Elements of Metric Gear Technology by SDP-SI. D815 technical section, §11, Table11-3, printed T-111, axial overlap ratio
Gear face load distribution describes how tooth-contact load is spread across the engaged gear face width. Equal total transmitted force can produce different local loads when shafts tilt, supports deform or tooth traces are imperfect. A geometrically available gear effective face width therefore does not establish uniform loading. The manufacturer's tooth-flank gear face load factor accounts for support arrangement and the expected quality of contact under load.[ref]
Elements of Metric Gear Technology by SDP-SI. D815 technical section, §17.2.12, printed T-164 and Table17-11, tooth-flank load distribution factor
For a simple axial line-load model, let have units over . Its total normal force isUniform loading gives . An illustrative tilted distribution isIts integral remains , while its largest line load is . With , and , the two edges carry20 and80N/mm, compared with the50N/mm mean. The peak-to-mean ratio1.6 characterizes this constructed model; it is not a substitute for the manufacturer's standard factor calculation.
The gear contact pattern can reveal where mating tooth flanks touch, but an unloaded marking test alone does not measure the operating force density. A loaded comparison must specify applied torque, shaft positioning and support deformation. In helical gears, changing tooth-contact lines and multiple simultaneous contacts also require a consistent choice of time and projected width. A wider tooth can reduce mean load per width while still suffering a concentrated edge load; width and alignment must be considered together.
A gear contact pattern is the observed region of tooth-flank contact during a stated mesh test. Its position and extent reveal how the installed tooth surfaces meet. A gear contact marking test uses a thin marking layer and controlled rotation to make that region visible; the mounting position, transmission direction and applied torque belong in the test description. Manufacturer guidance treats surface-contact checks as evidence about the assembled mesh, including shaft alignment.[ref]
A useful bench comparison holds the gear pair and test conditions fixed, records the initial mark, then changes one alignment setting and repeats the test. A mark moving toward one face edge indicates a change in where the flanks meet. This is an observation of contact location, rather than an automatic measurement of operating pressure or a universal diagnosis of the alignment error.
For example, a mark occupying the full20mm gear effective face width is compatible with a hypothetical uniform line load , but also with the tilted positive distributionBoth integrate to1000N, yet their peak line loads are50 and80N/mm. Merely observing full-width contact cannot choose between those gear face load distributions. The gear face load factor or local stress needs additional load/deformation information.
Loaded and lightly loaded patterns can also differ because shaft, housing and tooth deformation change the gap. A quantitative loaded assessment may use strain measurements or a validated contact model alongside the pattern; the2006 gear-rating standard explicitly distinguishes comprehensive load assessment from the limited information in a bearing pattern.[ref]
A gear contact marking test makes a gear contact pattern visible by using a thin contrasting marking layer and rolling the mating gears under stated conditions. The observed transfer or removal of the layer locates the region where the flanks meet closely enough to mark. A useful test record includes the marked flank, rotation direction, mounting position, backlash and applied torque. Manufacturer guidance discusses tooth-surface contact as an assembly and alignment check.[ref]
A controlled comparison changes one alignment setting while keeping the same marking method and loading condition. A shift of the mark toward an edge then records a change in the mesh geometry. Changing layer thickness at the same time would confound that comparison: the visible pattern is the response of the surfaces and the marking process together.
An original threshold model illustrates this limitation without claiming a universal paint law. Suppose an unloaded gap over a face isStipulate that a mark appears wherever , with gear marking-layer gap threshold . At the marked width is ; at it is . The indicated coverage doubles even though the underlying gap is unchanged. Real transfer also depends on deformation and the marking material.
Nor does a broad mark uniquely determine the gear face load distribution. Operating torque deforms teeth, shafts and supports, so a lightly loaded pattern can differ from a loaded one. The historical gear-rating standard distinguishes comprehensive loaded assessment from the limited information in a bearing pattern.[ref]
A meaningful validation pairs the pattern with an independent load-sensitive observation, such as tooth-root strain, or a checked deformation model. The question is whether the setup places contact where intended under the specified condition, rather than whether one visually attractive mark proves uniform pressure at every operating load.
A gear marking-layer gap threshold is an effective separation below which a stated marking process produces a visible transfer or removal of material. It is a model of the observation in a gear contact marking test, rather than a universal thickness or a material constant. Layer thickness, pressure, rolling history and the marking material can all matter; a visible gear contact pattern does not directly give local operating pressure.
For an original idealization, let the unloaded separation across a face beand stipulate a visible mark where . Here is the effective threshold, the minimum gap and its slope magnitude. For a centered pattern on face width , the predicted marked width isChoose , and . Thresholds and give marked widths and . The geometry has not changed; the observation threshold has.
Away from the onset and saturation corners,Here a threshold change changes the indicated width by . In the shallow-gap limit, small changes of the marking process can therefore cause conspicuous changes in the visible pattern.
A controlled comparison should hold the coating method, applied torque and number/direction of roll-throughs fixed, then vary one geometric setting. A separate fixture with known separations can test whether a proposed threshold model describes the marking process, without treating nominal coating thickness as an exact gap measurement.
Manufacturer contact guidance describes patterns as evidence about assembled tooth surfaces, and the historical rating standard limits the load information inferred from a bearing pattern.[ref]
Elements of Metric Gear Technology by SDP-SI. Section 19.1, surface contact of spur and helical meshes, printed T-221
[ref] The threshold equation is a deliberately specified illustrative model; actual deformation and transfer behavior need validation before converting a mark into a quantitative gap or gear face load distribution.A gear face load factor quantifies the effect of nonuniform load across the engaged gear face width. For the contact-load convention in ISO 6336-1:2006, compares maximum line-load intensity with the mean intensity over the stated width:Here is the total load represented by that distribution and is its evaluation width. A uniform distribution gives1; an edge-concentrated distribution gives a larger value. The numerator and denominator must refer to the same load convention and operating condition.[ref]
For an original illustrative distribution over ,total load is1000N, mean line load is50N/mm and maximum line load is80N/mm. Thus . A uniform distribution with the same width and total load gives1. The gear contact pattern can cover the whole width in both cases.
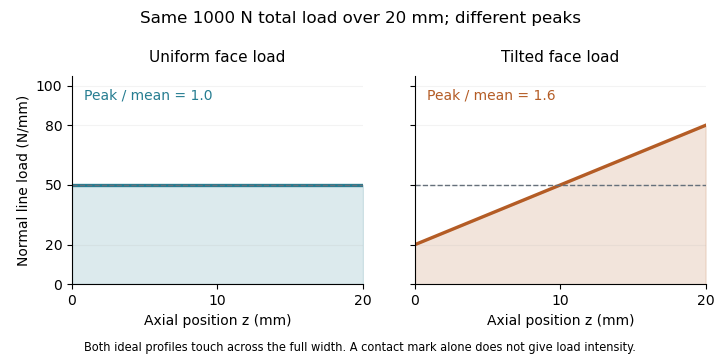

For ideal elastic line contact at fixed geometry and material, Hertzian contact pressure scales with the square root of line load. The corresponding gear contact-stress load factor is therefore in this simplified comparison. Multiplying the contact pressure itself by1.6 would confuse a load-intensity ratio with a stress ratio. This scaling does not replace a complete gear-rating calculation.
The manufacturer's treatment connects face-load assessment to shaft-support placement, shaft stiffness and loaded contact quality.[ref] A value inferred from a toy line-load profile is consequently useful for understanding the factor, while a real design must obtain the relevant distribution or factor from a method appropriate to its geometry and load state.
The gear contact-stress load factor is the multiplier associated with the face-load term in a contact-stress calculation where Hertzian contact pressure scales with the square root of local line load. It distinguishes a stress ratio from the underlying gear face load factor. The historical definition of compares maximum line-load intensity with the mean over the evaluation width.[ref]
For ideal elastic line contact, hold the effective geometry and material fixed. Write the peak pressure aswhere is load per contact length, the effective elastic modulus and the effective radius. If the largest line load is , division by the pressure calculated from the mean line load givesThe square root follows from the pressure model; it is not a second independent multiplier on the load.
For an original example, a face-load ratio gives a stress multiplier . A mean-line-load reference pressure would become under these assumptions. Multiplying pressure directly by would instead give and count the load ratio as though it were a stress ratio. Increasing effective line load fourfold doubles this model pressure.
Small relative uncertainties also scale differently:Thus a small relative change in produces about a relative change in its square root to first order. This sensitivity concerns that term alone; uncertainties in material, geometry and the reference load remain.
A local stress scaling does not predict gear surface pitting life on its own. Contact position, curvature, load history and material response matter. A primary NASA analysis explicitly combined varying tooth loads and contact geometry with a fatigue-life model.[ref]
Predicted Effect of Dynamic Load on Pitting Fatigue Life for Low-Contact-Ratio Spur Gears by David G. Lewicki. Summary, printed p. 1; Analysis, tooth-contact intervals and varying curvature/load
A real rating must keep all factors and load conventions consistent with the chosen method.Gear effective face width is the usable axial width participating in a stated cylindrical gear mesh. It must be distinguished from each component's nominal gear face width, and from a claim that every part of that width carries equal load. The normal/transverse tooth geometry and gear overlap ratio use this engaged width, while gear face load distribution describes how the load actually occupies it.[ref]
Elements of Metric Gear Technology by SDP-SI. D815 technical section, §11, Table11-3, axial overlap ratio; §17.2.12, tooth-flank load distribution
An elementary geometric model treats the two toothed widths as intervals and on their common axial coordinate. Their available overlap isFor one20mm-wide gear occupying and a16mm-wide mate centered at , the second interval is . Their overlap is only12mm. The mean line load for a hypothetical uniformly shared normal force of1200N is then100N/mm, rather than the60N/mm obtained by using the first gear's entire nominal width.
With gear normal module and gear helix angle , gear axial pitch is . The12mm overlap gives geometric gear overlap ratio , compared with for20mm. Axial positioning can therefore alter overlap without changing the ideal gear ratio.
The interval calculation assumes the flanks remain usable throughout their common extent. Relief, damaged regions or partial contact can require a more specific working-width convention. Uneven loading is not generally corrected by shrinking width until a uniform-load formula looks plausible; a stated load-distribution model is needed to predict local loading.
Articles by others on the same topic
There are currently no matching articles.