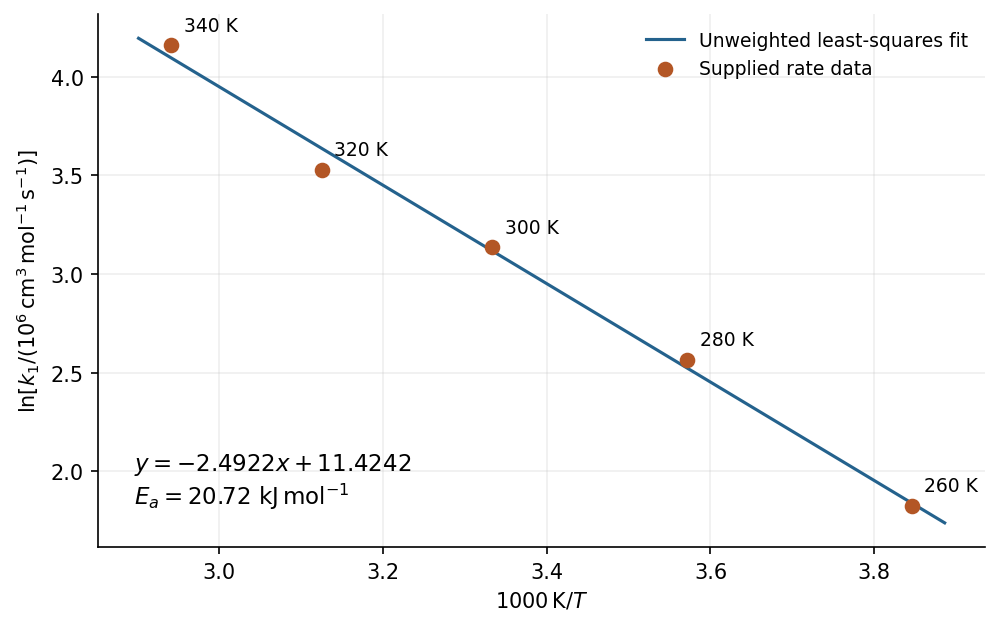
An unweighted least-squares Arrhenius plot using all five data points gives . Define the dimensionless ordinate with , and set . The model isFor increasing temperatures, the five ordinates are , , , , and . The linear regression slope and intercept areConsequently . The corresponding fitted . A two-point calculation using just the endpoints gives approximately ; the difference reflects the rounded, imperfectly collinear data rather than a unit conversion.

Articles by others on the same topic
There are currently no matching articles.