The expression is the Binet formula for the Fibonacci numbers. Compute the two roots and round the result to the nearest integer:
from math import sqrt


def binet(n):
    phi = (1 + sqrt(5)) / 2
    psi = (1 - sqrt(5)) / 2
return round((phi**n - psi**n) / sqrt(5))list50 = [binet(n) for n in range(1, 51)]Use the first 10, 20, 30 and 40 entries of the already computed list in a two-by-two array of axes. Each subplot needs an index sequence starting at one and having the same length as its data:
import matplotlib.pyplot as plt

fig, axes = plt.subplots(2, 2, figsize=(8, 6), layout="constrained")
for ax, stop in zip(axes.flat, [10, 20, 30, 40]):
    ax.plot(range(1, stop + 1), list50[:stop])
    ax.set(title=f"n = {stop}", xlabel="n", ylabel="f(n)")
plt.show()list50, even though the requested four panels stop at 40.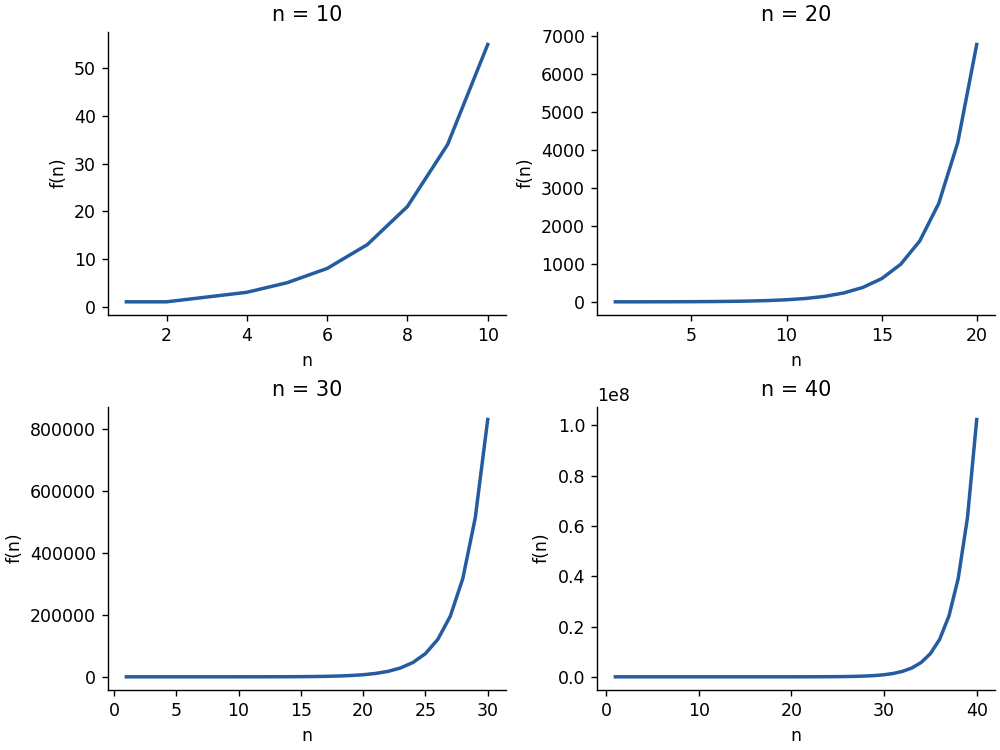

Articles by others on the same topic
There are currently no matching articles.