The fitted grouped-binomial logistic regression generalized linear model treats seasonal hits as independent variables, with andThus the response supplied to
glm is a proportion, and weights=AB supplies its binomial denominator; it is not a regression with equally precise seasonal averages. I(Age^2) forms the numerical square rather than using a formula operator. The estimates maximize up to a constant, where , .The observed negative Hessian is , . Expanding the score around the true parameter and applying a central-limit approximation gives . The reported standard errors are square roots of the diagonal entries of this inverse; the binomial dispersion is fixed at one. Each
z value divides the coefficient estimate by its standard error, and the reported two-sided Wald test uses a standard normal approximation under the corresponding zero-coefficient hypothesis.The last line reports the deviance against the saturated model,with . There are 22 seasonal observations and three fitted parameters, so 19 degrees of freedom. Under the quadratic-logit model, independent binomial sampling and sufficiently large expected counts, . The value 23.345 gives an upper-tail probability about 0.22, no evidence of lack of fit at conventional levels. This approximation and the independence assumption should not be confused with an exact test of a player's ability.
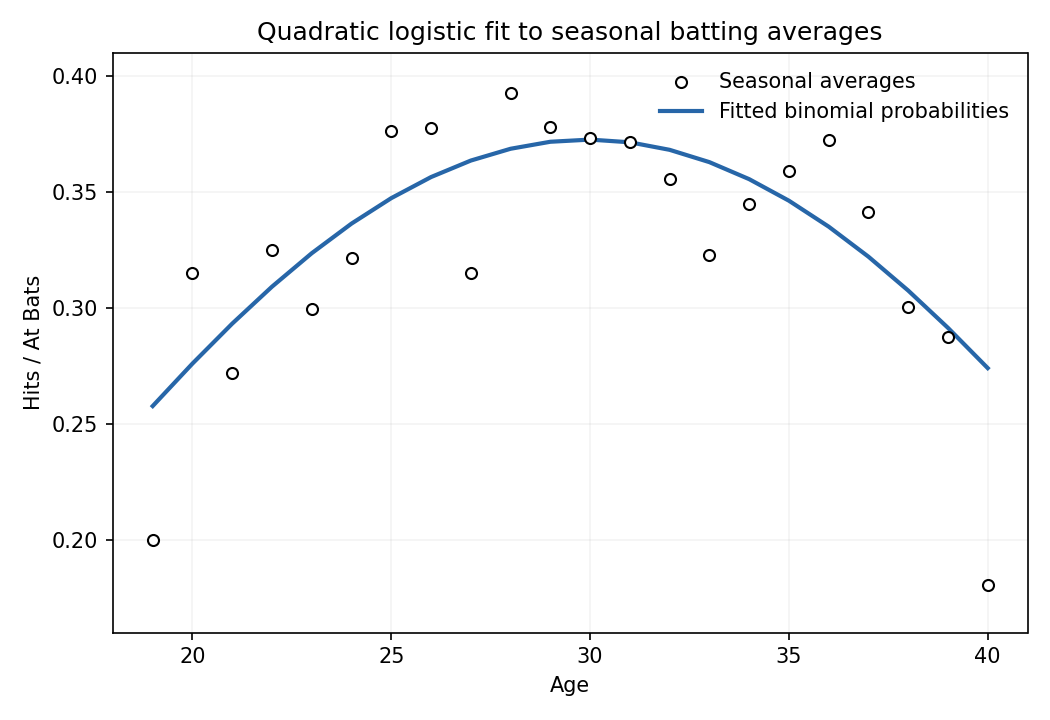
The final commands recover the coefficients, apply the inverse logit , plot the observed averages against age, and join the fitted probabilities at the observed ages. The fitted curve is smooth, rises towards its peak at , then falls. Its maximum is about 0.373; the early and late observed points include markedly lower averages. The plot uses equally sized points even though their binomial precisions differ.

Articles by others on the same topic
There are currently no matching articles.