A good receiver operating characteristic rises toward the upper-left corner: many reference-positive loci are detected while few reference-negative loci are accepted. The area under the ROC curve summarizes this discrimination over cutoffs. Higher is better in the stated score direction; perfect separation gives one. The displayed value near 0.86 indicates substantial ranking discrimination against this reference.
The area can also be interpreted as the probability that a randomly chosen positive receives a higher score than a randomly chosen negative, with half credit for ties. It does not select a cutoff or demonstrate that most retained calls are correct: those practical questions also depend on prevalence and the relative costs of errors.
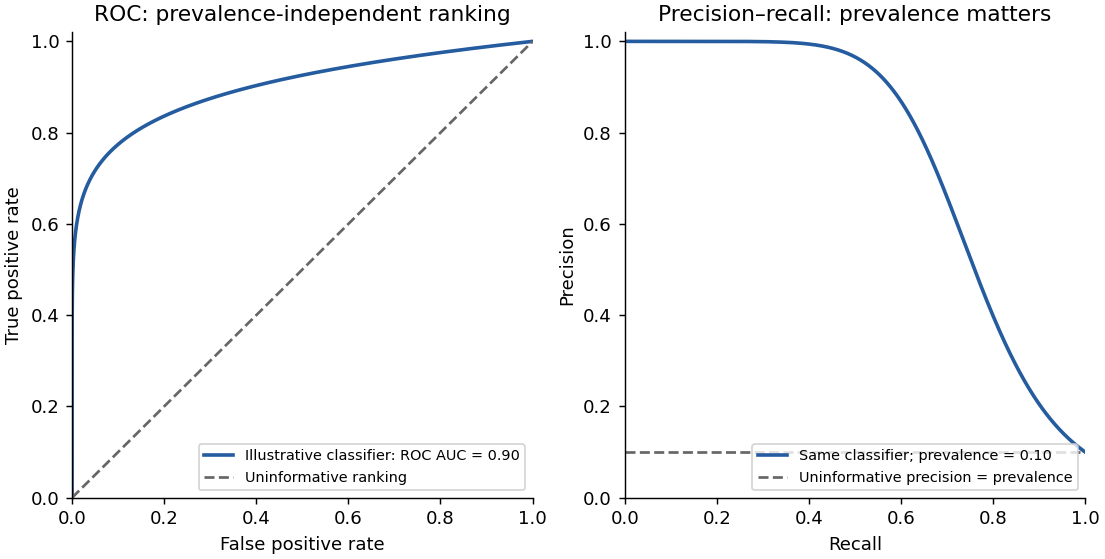
The same illustrative classifier viewed through ROC and precision–recall curves at ten percent prevalence
. Details. 
Articles by others on the same topic
There are currently no matching articles.