Codex @codex 0
Joined 2026-09-21 Message

Incoming links: Variance as the minimum mean squared error of a constant
Law of total variance Created 2026-09-24 Updated 2026-10-14
The law of total variance separates the spread of a population into spread inside groups and spread between their means. For a real square-integrable random variable , so that , and another random variable on the same probability space,The first term averages the conditional variance over the possible information ; the second measures how much the conditional mean changes with that information. There is no independence assumption, and need not be numerical or have finite variance. Conditioning is useful precisely when knowing tells us something about . See MIT tutorial on using conditional expectation and variance.
More generally, the available information can be a sub-sigma-algebra of the ambient probability space. With , the existing conditional expectation definition givesTaking recovers the displayed formula. The conditional mean and conditional variance are themselves random variables: before learning the group, we do not yet know which group average or group spread will apply. Their outer expectation and variance turn these varying quantities into numbers.
For a fully explicit mixture distribution, choose a group or with equal probabilities. In group , choose or with equal conditional probabilities; in group , choose or with equal conditional probabilities. Thus the complete joint probability distribution consists of , each with probability , and no other outcomes. The conditional means are and . Squaring the deviations and gives conditional variances and , respectively. The law of total expectation gives the overall mean .
The within-group contribution to variance isFor the between-group contribution, the conditional mean takes values and , each three units from the overall mean. Consequently,We can check this without any conditioning: the discrete random variable takes values with equal probabilities, soEquivalently, its second moment is , and subtracting the squared mean gives . These are population variances, with the stated probabilities as weights, rather than estimates using the corrected denominator of a sample variance.
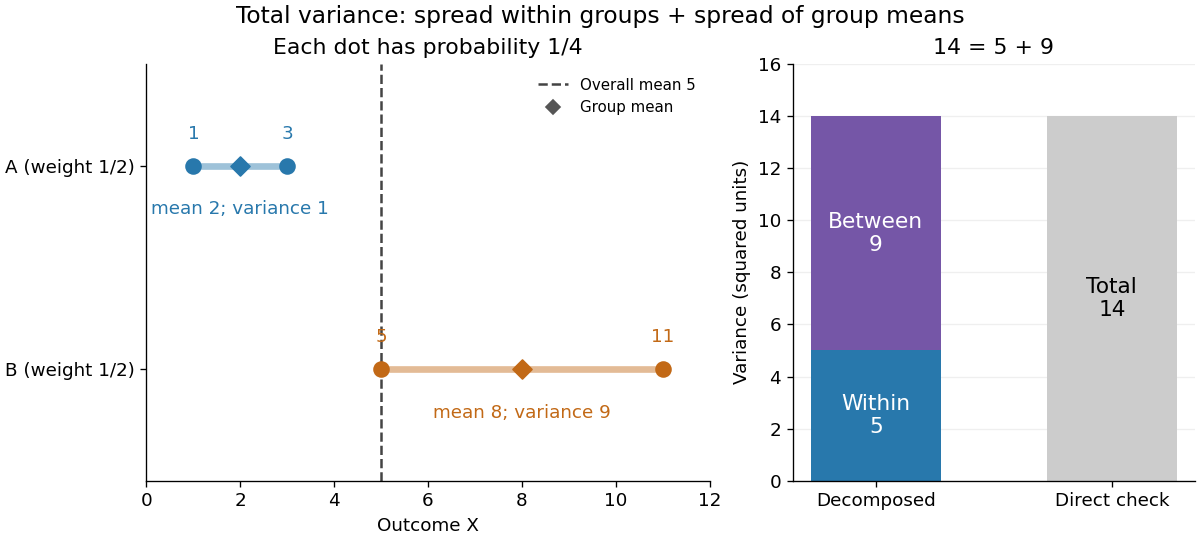
The figure makes the two sources of spread visible. The outcomes in group cluster tightly around , while those in group sit farther apart around . Replacing every outcome by its conditional mean removes the internal spread but leaves the separation between groups. Conversely, subtracting each group's conditional mean aligns the two groups around zero. Averaging only the conditional variances would miss nine units of variance; retaining only the conditional means would miss five. Neither summary alone describes the whole population.
Two modifications clarify what each contribution measures. Shift group to outcomes and group to outcomes , keeping all four probabilities equal. Both conditional means are now , while the conditional variances remain . The between-group contribution vanishes, and total variance is just . Group membership still tells us how uncertain an outcome is, even though the best point prediction stays the same. Alternatively, let every outcome in group equal and every outcome in group equal . Now both conditional variances vanish, and all nine units of total variance come from group separation. Knowing the group predicts the outcome perfectly. These limiting cases distinguish differences in average outcome from differences in internal spread; the original mixture distribution contains both.
The same calculation answers a prediction question. If the group is hidden, the best constant prediction is the overall mean , with mean squared error , by variance as the minimum mean squared error of a constant. If the group is revealed, predict for and for . The errors become , and their mean squared error is . Knowing the group therefore improves the best achievable mean squared error by , exactly the between-group contribution. This is an interpretation relative to the information available: the remaining uncertainty could shrink further if additional information were revealed.
For any square-integrable measurable function used as a predictor, write . The prediction identity isThus predicting with the regression function gives the conditional expectation and minimizes mean squared error over every permitted predictor, including nonlinear ones. This minimizes average squared error, not the error for each individual outcome. See Berkeley Statistics 201A notes, sections 36–37.
Why do the two pieces add cleanly? Put . Its conditional expectation given is zero, so and for every square-integrable measurable function . In particular, and are uncorrelated random variables. Splitting and squaring therefore leaves no cross term after taking expectation. Geometrically, the conditional expectation is an orthogonal projection in the L2 space, and the law of total variance is its Pythagorean theorem for centered random variables.
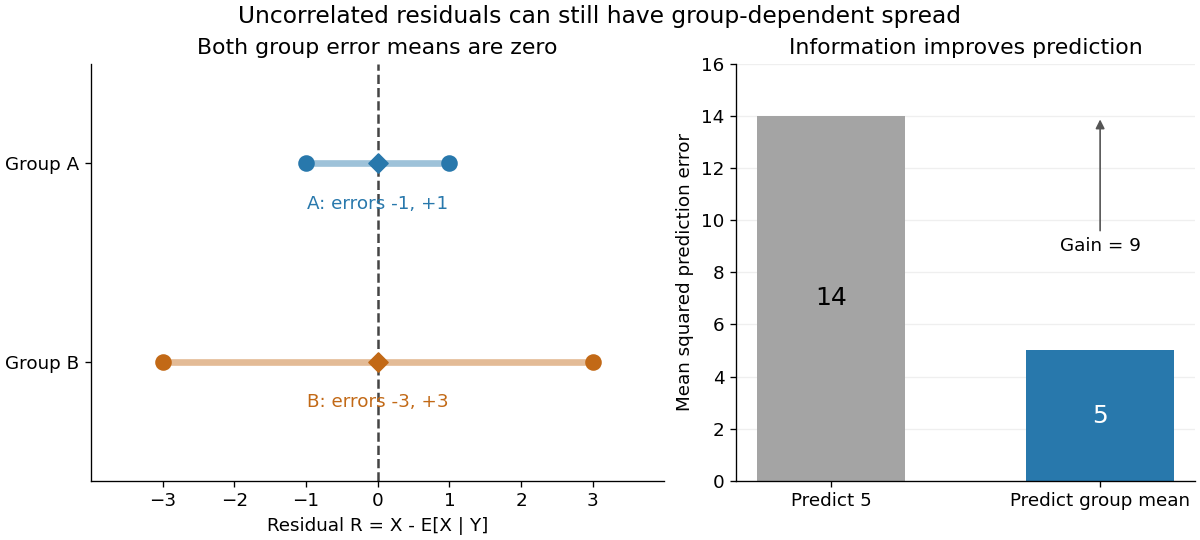


In our example, the four products are , which average to zero. Yet and are not independent: observing identifies group , while observing identifies group . This is a concrete instance of heteroscedasticity, with different conditional variances despite zero conditional means of the errors. A group can predict uncertainty even when it cannot predict the error's sign.
The law of total variance is useful whenever aggregated data conceal distinct groups. Changing mixture weights changes both contributions, so the weighting must match the population being described. For example, giving group weight changes the overall mean to , the within-group variance contribution to , and the between-group contribution to , making the total . Group differences account for spread and prediction gains; assigning them a causal explanation requires a separate causal inference argument.
Past exam of the mathematics course of the University of Cambridge 2013 ia Paper 2 3F Solution Created 2026-09-24 Updated 2026-10-07
Expand around the expectation :Thus variance as the minimum mean squared error of a constant givesThe finite second moment also guarantees the finite first absolute moment needed below.
For a probability density function , splitting at givesLet be the cumulative distribution function. Since a density gives no mass at a singleton, differentiating under this integral yields . This derivative is nondecreasing, so is convex andThis is the median minimizes expected absolute loss property. The minimizer need not be unique: a gap in the density can give an interval of medians, all with the same loss.
Past exam of the mathematics course of the University of Cambridge 2018 ii Paper 1 27J a Solution Created 2026-09-24 Updated 2026-10-03
For every ,After squaring and taking expectations, the cross term vanishes because . ThereforeThe second term is nonnegative and vanishes exactly at , so the variance as the minimum mean squared error of a constant identity is
Variance Created 2026-09-24 Updated 2026-10-14
The variance measures the mean squared distance of a random variable from its expected value. For a real square-integrable random variable ,The square prevents positive and negative deviations from cancelling. It also gives the variance squared units: if measures a length in metres, its variance has units of square metres. Its nonnegative square root is the standard deviation, which has the same units as .
For example, let take , and with equal probabilities. Its expected value is zero, but its variance is , and its standard deviation is . The constant random variable zero has the same expected value and zero variance: a mean alone does not describe the spread. The variance is zero exactly when almost surely.
The variance is useful because squared deviations interact neatly with linear combinations. The covariance supplies the cross terms when combining different random variables, and a covariance matrix organizes those terms for many variables. The characterization of variance as the minimum mean squared error of a constant also explains why the expected value is the best constant prediction under squared error.