Topics (194k) Articles (196k) Users (296) Discussions (237) Comments (383) Files (715) New article

Upside beta is a financial metric that measures the sensitivity of an asset's returns to the positive movements of the overall market. It indicates how much the asset's value is expected to increase in response to market gains. This concept is often used in the context of portfolio management and investment analysis, particularly for equities. While standard beta quantifies an asset's overall volatility relative to the market (both up and down), upside beta specifically focuses on the asset's behavior during bullish market conditions.
The Two-Moment Decision Model is a framework used to understand how individuals make choices based on two key moments: the framing of the decision and the evaluation of outcomes. This model emphasizes the distinction between two separate stages in the decision-making process: 1. **First Moment (Framing):** This stage involves how a decision is presented or framed. The way information is framed can significantly affect how choices are perceived and which options are favored.
Superhedging is a financial concept primarily used in the context of options and contingent claims. It refers to a strategy where an investor takes a position to completely hedge against potential losses from a certain financial obligation or payoff, ensuring that the worst-case scenario is covered, regardless of market conditions. The "superhedging price" is the minimum cost at which an investor can acquire the necessary financial instruments (like options or other derivatives) to achieve this complete hedge.
Spectral risk measures are a class of risk measures that incorporate a risk-averse decision-maker's preferences regarding the probability distribution of risks. They are particularly useful in financial risk management and portfolio optimization. ### Key Features of Spectral Risk Measures: 1. **Probabilistic Approach**: Spectral risk measures utilize the entire probability distribution of potential losses rather than focusing on specific loss thresholds (like Value at Risk) or specific moments (like expected shortfall).
The term "solvency cone" typically arises in the context of optimization, finance, and mathematical programming, particularly in relation to characterizing feasible sets in various constrained optimization problems. It is particularly useful in understanding the conditions under which certain constraints related to financial solvency can be satisfied. In a broader sense, a solvency cone is a geometric representation that defines the set of states or conditions under which a financial position is considered "solvent".
A risk-neutral measure is a concept used primarily in financial mathematics and quantitative finance, particularly in the context of pricing derivatives and financial instruments. It is a probability measure under which the present value of future cash flows can be calculated by discounting the expected payoffs at the risk-free rate, without needing to consider the risk preferences of investors. In a risk-neutral world, all investors are indifferent to risk, which means they require no additional return for taking on more risk.
The Omega ratio is a risk-return measure used in finance to assess the performance of an investment or a portfolio. It provides a way to evaluate the likelihood of achieving returns above a certain threshold while taking into account the downside risk. The Omega ratio is calculated by comparing the probability-weighted returns of an investment above a specified target return (often chosen as zero or a risk-free rate) to the probability-weighted returns below that target.
Multiple factor models are financial models used to explain the returns of an asset or a portfolio by examining its relationship to various factors. These factors can be economic, fundamental, or statistical variables that capture the systematic risks affecting returns. The basic premise is that the returns on an asset are driven by multiple underlying influences rather than a single factor, providing a more nuanced understanding of performance and risk.
Modern Portfolio Theory (MPT) is an investment theory introduced by economist Harry Markowitz in the 1950s. It provides a framework for constructing a portfolio of assets that aims to maximize expected return for a given level of risk, or conversely, to minimize risk for a given level of expected return.
Liquidity at Risk (LaR) is a financial metric used to assess the potential decrease in liquidity a firm may face during a specified time period under adverse market conditions. This metric helps organizations understand how much liquidity might be lost if they encounter stressed market conditions, which can hinder their ability to quickly convert assets to cash without significant losses. Liquidity is crucial for businesses, as it affects their ability to meet short-term financial obligations, invest in opportunities, and manage unforeseen expenses.
Isoelastic utility, also known as constant relative risk aversion (CRRA) utility, is a type of utility function used in economics to model the preferences of individuals with respect to consumption over time and uncertainty. The key characteristics of isoelastic utility are that it represents a consistent level of relative risk aversion and exhibits constant elasticity of substitution between different levels of consumption.
Hyperbolic absolute risk aversion (HARA) is a concept in economics and finance that describes a particular class of utility functions and how they capture an individual's risk preferences. In general, risk aversion refers to the tendency of individuals to prefer certainty over uncertainty, particularly in the context of financial decisions. The concept of absolute risk aversion is formalized through the Arrow-Pratt measure, which quantifies an individual's risk aversion based on their utility function.
Historical simulation is a method used in finance to assess the value-at-risk (VaR) and to analyze other risk metrics by using historical market data. This technique helps financial institutions and investors understand the potential losses or gains that could occur over a certain period based on actual historical price movements of assets. Here’s a breakdown of how historical simulation works: 1. **Historical Data Collection**: Historical price data for the assets or portfolios being analyzed are collected.
As of my last knowledge update in October 2023, GovernmentRisk360 is a platform designed to provide risk management solutions and insights specifically tailored for government agencies and organizations. It often includes features such as risk assessment tools, compliance management, governance frameworks, and strategies to enhance decision-making and mitigate potential risks. The platform typically emphasizes the importance of transparency, accountability, and effective management of public resources, helping governments navigate challenges related to public safety, regulatory compliance, and operational efficiency.
The Fama-French three-factor model is an asset pricing model that enhances the Capital Asset Pricing Model (CAPM) by adding two factors to account for the observed anomalies in stock returns that CAPM could not explain. Developed by Eugene Fama and Kenneth French in the early 1990s, the model aims to provide a better insight into the determinants of expected stock returns.
Exponential utility refers to a specific type of utility function commonly used in economics and finance to model individual preferences under risk. The exponential utility function is particularly notable for its properties related to risk aversion and its mathematical simplicity.
Entropic Value at Risk (EVaR) is a risk measurement tool that extends the traditional notion of Value at Risk (VaR). Traditional VaR estimates the maximum potential loss an investment portfolio could experience over a specified time period at a given confidence level. However, VaR has limitations, such as its inability to provide information about the tail risk—the risk of extreme losses beyond the VaR threshold.
Entropic risk measures are a class of risk measures in the field of finance and insurance that are based on the concept of entropic or exponential utility functions. They provide a way to assess the riskiness of financial positions or portfolios by evaluating how the uncertainty in potential outcomes impacts decision-making.
Earnings at Risk (EaR) is a financial risk management measure that quantifies the potential adverse impact on a company's earnings due to changes in market conditions, particularly in relation to interest rates, foreign exchange rates, commodity prices, and other factors. It helps businesses assess how fluctuations in these variables might negatively affect their profitability over a specified period.
Dynamic risk measures refer to a class of risk measures that assess the risk of a financial position or portfolio over time, taking into account the evolving nature of markets, conditions, and the specific circumstances surrounding financial instruments. Unlike static risk measures, which provide a snapshot of risk at a single point in time, dynamic risk measures are inherently time-dependent and may change as new information becomes available or as time passes.
Pinned article: Introduction to the OurBigBook Project
Welcome to the OurBigBook Project! Our goal is to create the perfect publishing platform for STEM subjects, and get university-level students to write the best free STEM tutorials ever.
Everyone is welcome to create an account and play with the site: ourbigbook.com/go/register. We belive that students themselves can write amazing tutorials, but teachers are welcome too. You can write about anything you want, it doesn't have to be STEM or even educational. Silly test content is very welcome and you won't be penalized in any way. Just keep it legal!
Intro to OurBigBook
. Source. We have two killer features:
- topics: topics group articles by different users with the same title, e.g. here is the topic for the "Fundamental Theorem of Calculus" ourbigbook.com/go/topic/fundamental-theorem-of-calculusArticles of different users are sorted by upvote within each article page. This feature is a bit like:
- a Wikipedia where each user can have their own version of each article
- a Q&A website like Stack Overflow, where multiple people can give their views on a given topic, and the best ones are sorted by upvote. Except you don't need to wait for someone to ask first, and any topic goes, no matter how narrow or broad
This feature makes it possible for readers to find better explanations of any topic created by other writers. And it allows writers to create an explanation in a place that readers might actually find it.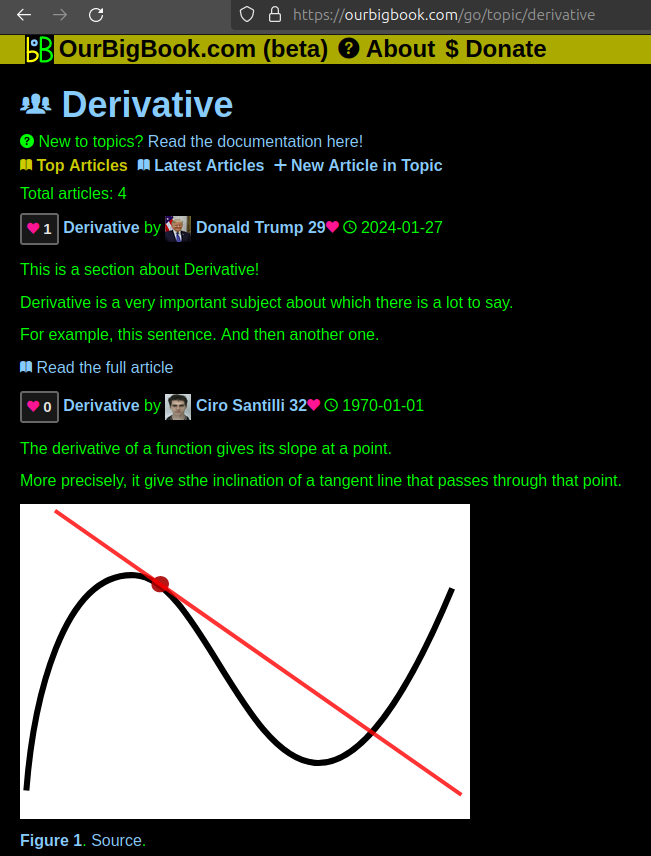
Figure 1. Screenshot of the "Derivative" topic page. View it live at: ourbigbook.com/go/topic/derivativeVideo 2. OurBigBook Web topics demo. Source. - local editing: you can store all your personal knowledge base content locally in a plaintext markup format that can be edited locally and published either:This way you can be sure that even if OurBigBook.com were to go down one day (which we have no plans to do as it is quite cheap to host!), your content will still be perfectly readable as a static site.
- to OurBigBook.com to get awesome multi-user features like topics and likes
- as HTML files to a static website, which you can host yourself for free on many external providers like GitHub Pages, and remain in full control

Figure 2. You can publish local OurBigBook lightweight markup files to either OurBigBook.com or as a static website.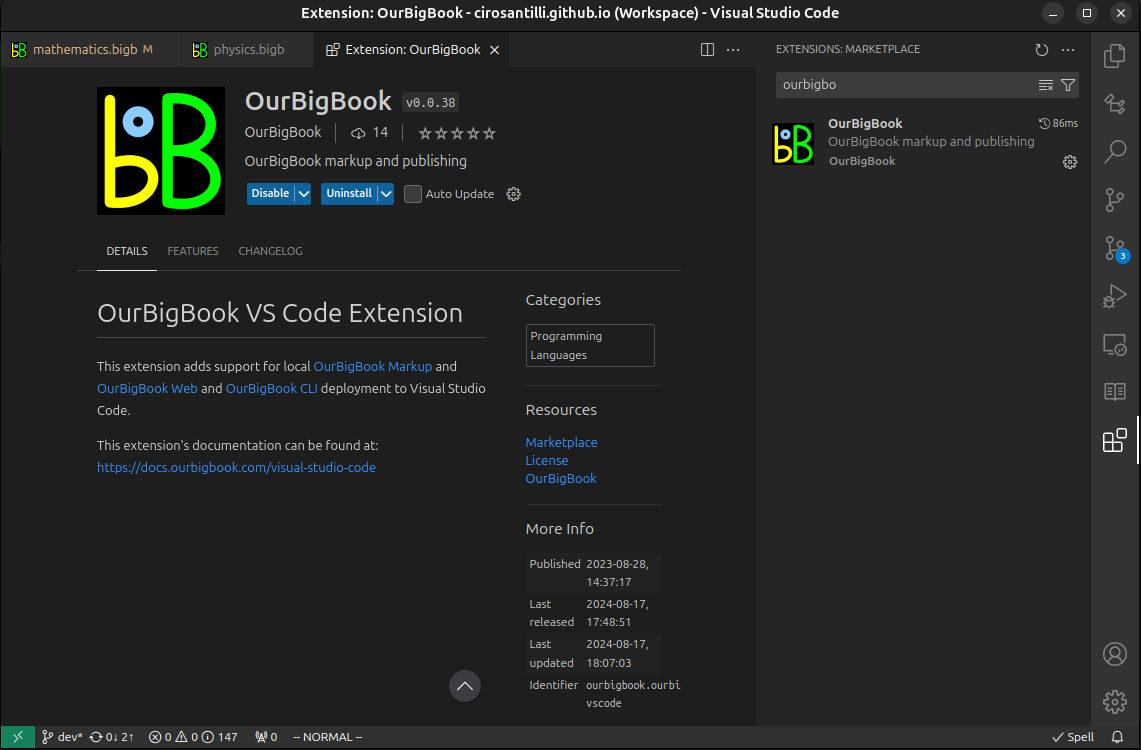
Figure 3. Visual Studio Code extension installation.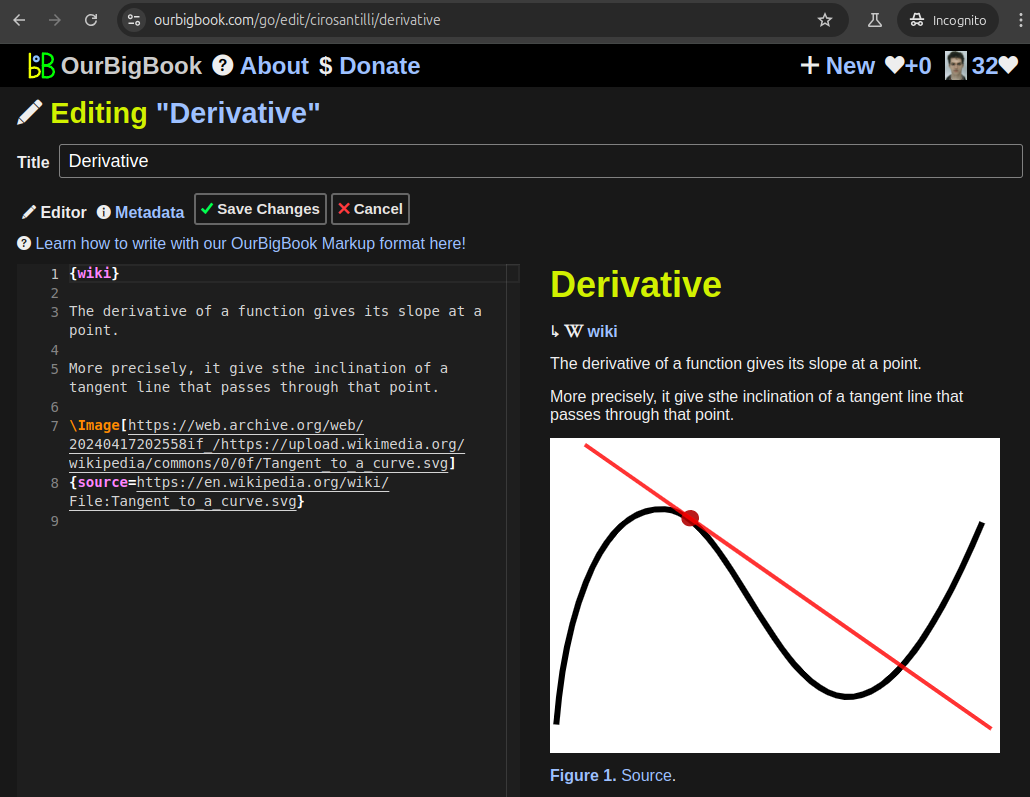
Figure 5. . You can also edit articles on the Web editor without installing anything locally. Video 3. Edit locally and publish demo. Source. This shows editing OurBigBook Markup and publishing it using the Visual Studio Code extension. 
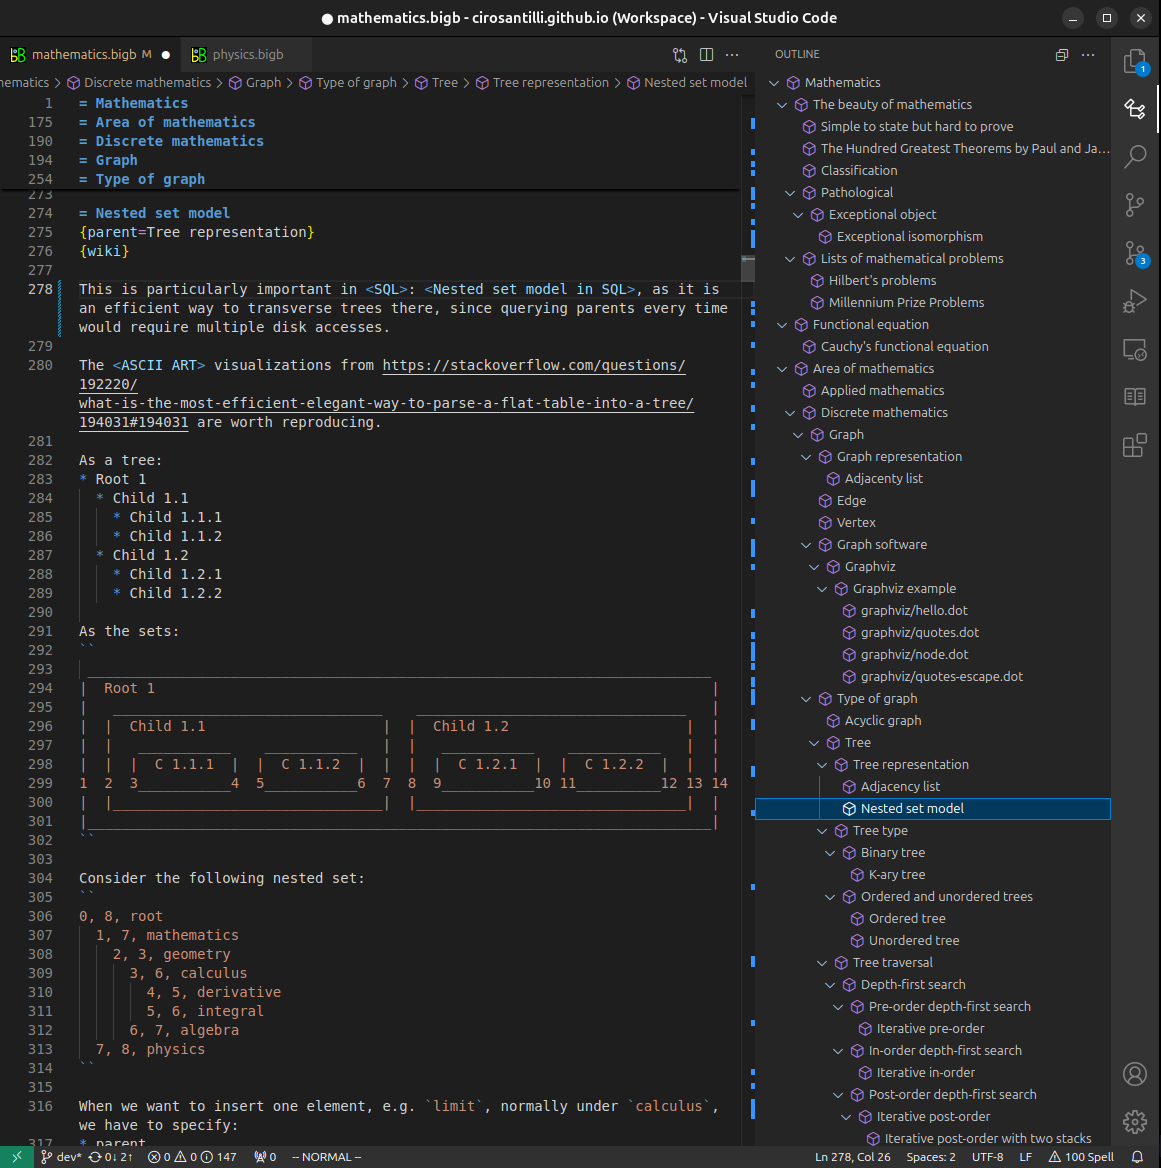
- Infinitely deep tables of contents:

All our software is open source and hosted at: github.com/ourbigbook/ourbigbook
Further documentation can be found at: docs.ourbigbook.com
Feel free to reach our to us for any help or suggestions: docs.ourbigbook.com/#contact