Topics (203k) Articles (205k) Users (301) Discussions (237) Comments (383) Files (715) New article

"Autowave" can refer to a few different things depending on the context. Here are a couple of possible interpretations: 1. **In Chemistry and Physics**: Autowave phenomena, often referred to in the context of nonlinear dynamics and reaction-diffusion systems, describe self-organizing propagating waves in a medium. These autowaves can emerge in chemical reactions, biological systems, and heat transfer processes, among others.
The term "Automated Efficiency Model" generally refers to a systematic approach or framework designed to enhance the efficiency of processes through automation. This can involve various technologies, practices, and strategies aimed at minimizing human effort while maximizing productivity and accuracy. Key components of an Automated Efficiency Model might include: 1. **Process Mapping**: Understanding and documenting existing workflows to identify areas where automation can be implemented.
The Arditi-Ginzburg equations are a set of mathematical equations that describe the dynamics of certain ecological systems, particularly in the context of predator-prey interactions and population dynamics. They are named after the scientists who proposed them, Arditi and Ginzburg, in the context of studying the stabilization and oscillatory behavior of ecological populations. The equations typically focus on the dynamics of two interacting species: a prey species and a predator species.
Sensitivity analysis is a key tool in multi-criteria decision-making (MCDM) processes, helping decision-makers understand how variations in input parameters affect outcomes. Below are several applications of sensitivity analysis in MCDM: 1. **Assessment of Parameter Influence**: Sensitivity analysis helps determine which criteria are most influential in the decision-making process. By varying the weights or scores of each criterion, decision-makers can identify the parameters that significantly affect the overall ranking of alternatives.
Sensitivity analysis plays a crucial role in model calibration across various fields, including engineering, environmental science, economics, and more. Here are some key applications of sensitivity analysis in model calibration: 1. **Parameter Identification**: Sensitivity analysis helps identify which model parameters most significantly affect output variables. By examining how small changes in parameters influence model predictions, researchers can prioritize parameters for calibration efforts. 2. **Uncertainty Quantification**: Understanding how uncertainty in parameters affects model outputs is essential.
Sensitivity analysis is a powerful tool used in environmental sciences to assess the behavior of models under varying conditions and inputs. It helps scientists, researchers, and policymakers understand how changes in parameters can influence outcomes in complex environmental systems. Here are some key applications of sensitivity analysis in environmental sciences: 1. **Model Calibration and Validation**: Sensitivity analysis helps identify which parameters significantly affect model outputs, facilitating more effective calibration and validation of environmental models. By focusing on the most sensitive parameters, researchers can improve model accuracy.
Sensitivity analysis is a critical tool in epidemiology that helps assess how the results of a study or model change in response to variations in parameters or assumptions. Here are some key applications of sensitivity analysis in this field: 1. **Model Validation**: Sensitivity analysis can be used to validate epidemiological models by testing how sensitive the outcomes are to changes in input parameters. This helps confirm the robustness of the model and its credibility in predicting disease spread.
The Apparent Infection Rate (AIR) is a measure used to estimate the proportion of individuals within a population that are infected by a particular pathogen or disease, based on observed cases. It is calculated by taking the number of reported or detected cases of infection and dividing it by the total number of individuals tested or surveilled, often expressed as a percentage.
Analysis is the process of breaking down complex information or concepts into smaller, more manageable components to better understand, interpret, and evaluate them. It can be applied in various contexts, including: 1. **Data Analysis**: Examining data sets to extract meaningful insights, identify patterns, and make informed decisions. This often involves statistical methods, data visualization, and interpretation of results.
Unified Modeling Language (UML) is a standardized modeling language used in software engineering to specify, visualize, implement, and document the artifacts of software systems. UML provides a set of graphical notations that allow developers and stakeholders to create models that represent the structure and behavior of software systems. Here are some key aspects of UML: 1. **Purpose**: UML helps to facilitate communication and understanding among project stakeholders, including developers, architects, analysts, and non-technical stakeholders.
Statistical models are mathematical representations that encapsulate the relationships between different variables in a dataset using statistical concepts. They are used to analyze and interpret data, make predictions, and infer patterns. Essentially, a statistical model defines a framework that simplifies reality, allowing researchers and analysts to make sense of complex data structures and relationships.
A radio frequency (RF) propagation model is a mathematical representation used to predict how radio waves propagate through various environments. These models are essential for designing and optimizing communication systems, including cellular networks, satellite communications, and broadcasting. They help engineers understand factors that affect signal strength and quality as radio waves travel from transmitter to receiver.
Models of computation are formal systems that describe how computations can be performed and how problems can be solved using different computational paradigms. They provide a framework for understanding the capabilities and limitations of different computational processes. Various models of computation are used in computer science to study algorithms, programming languages, and computation in general.
Model theory is a branch of mathematical logic that deals with the relationship between formal languages (which consist of symbols and rules for combining them) and their interpretations or models. It focuses on understanding the structures that satisfy given logical formulas, and it examines the properties and relationships between those structures. Here are some key concepts in model theory: 1. **Structures**: A structure consists of a set, called the universe, along with operations, relations, and constants defined on that set.
Formal specification languages are mathematically-based languages used to specify and describe the behavior, properties, and requirements of software systems or hardware designs. These languages provide a precise and unambiguous way to express system specifications, making it easier to analyze, verify, and reason about systems before implementation. ### Key Features: 1. **Mathematical Foundations**: Formal specification languages are grounded in mathematics, which helps in providing a clear and unambiguous description of system behavior.
Complex systems theory is an interdisciplinary framework used to study systems with many interconnected components that interact in various ways, leading to emergent behavior that cannot be easily understood by simply examining the individual parts. This theory is applicable in various fields such as physics, biology, economics, sociology, computer science, and ecology, among others. Key characteristics of complex systems include: 1. **Non-linearity**: The output of a complex system is not directly proportional to its input.
Color models are systems that define a way to represent colors in a structured format. They provide a standardized method for describing, interpreting, and communicating color information, which is essential in various fields such as graphic design, printing, photography, and digital media. Here are some common color models: 1. **RGB (Red, Green, Blue)**: - An additive color model where colors are formed by combining red, green, and blue light in varying intensities.
Pattern Blocks are a popular educational tool often used in early childhood and elementary education to teach various mathematical concepts such as spatial awareness, geometry, symmetry, and fractions. These blocks are typically made of wood or plastic and come in various shapes, including triangles, squares, hexagons, parallelograms, and trapezoids, each usually in different colors.
Montessori sensorial materials are specially designed educational tools used in Montessori classrooms to help children explore and refine their senses. These materials are tactile and engaging, promoting sensory development in a systematic way. The core idea is to provide children with concrete experiences that enhance their ability to observe, categorize, and understand the world around them through their senses: sight, sound, touch, taste, and smell.
Pinned article: Introduction to the OurBigBook Project
Welcome to the OurBigBook Project! Our goal is to create the perfect publishing platform for STEM subjects, and get university-level students to write the best free STEM tutorials ever.
Everyone is welcome to create an account and play with the site: ourbigbook.com/go/register. We belive that students themselves can write amazing tutorials, but teachers are welcome too. You can write about anything you want, it doesn't have to be STEM or even educational. Silly test content is very welcome and you won't be penalized in any way. Just keep it legal!
Intro to OurBigBook
. Source. We have two killer features:
- topics: topics group articles by different users with the same title, e.g. here is the topic for the "Fundamental Theorem of Calculus" ourbigbook.com/go/topic/fundamental-theorem-of-calculusArticles of different users are sorted by upvote within each article page. This feature is a bit like:
- a Wikipedia where each user can have their own version of each article
- a Q&A website like Stack Overflow, where multiple people can give their views on a given topic, and the best ones are sorted by upvote. Except you don't need to wait for someone to ask first, and any topic goes, no matter how narrow or broad
This feature makes it possible for readers to find better explanations of any topic created by other writers. And it allows writers to create an explanation in a place that readers might actually find it.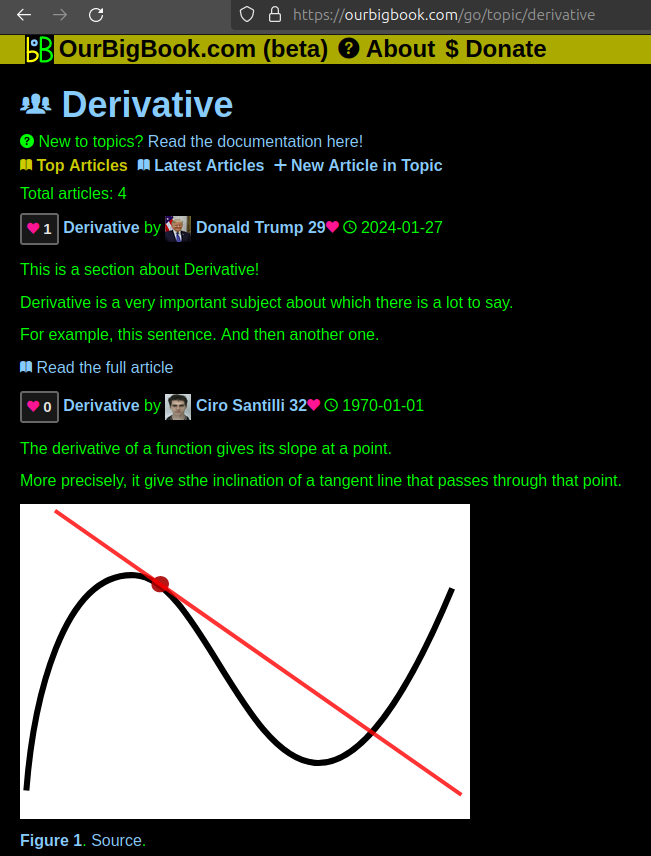
Figure 1. Screenshot of the "Derivative" topic page. View it live at: ourbigbook.com/go/topic/derivativeVideo 2. OurBigBook Web topics demo. Source. - local editing: you can store all your personal knowledge base content locally in a plaintext markup format that can be edited locally and published either:This way you can be sure that even if OurBigBook.com were to go down one day (which we have no plans to do as it is quite cheap to host!), your content will still be perfectly readable as a static site.
- to OurBigBook.com to get awesome multi-user features like topics and likes
- as HTML files to a static website, which you can host yourself for free on many external providers like GitHub Pages, and remain in full control
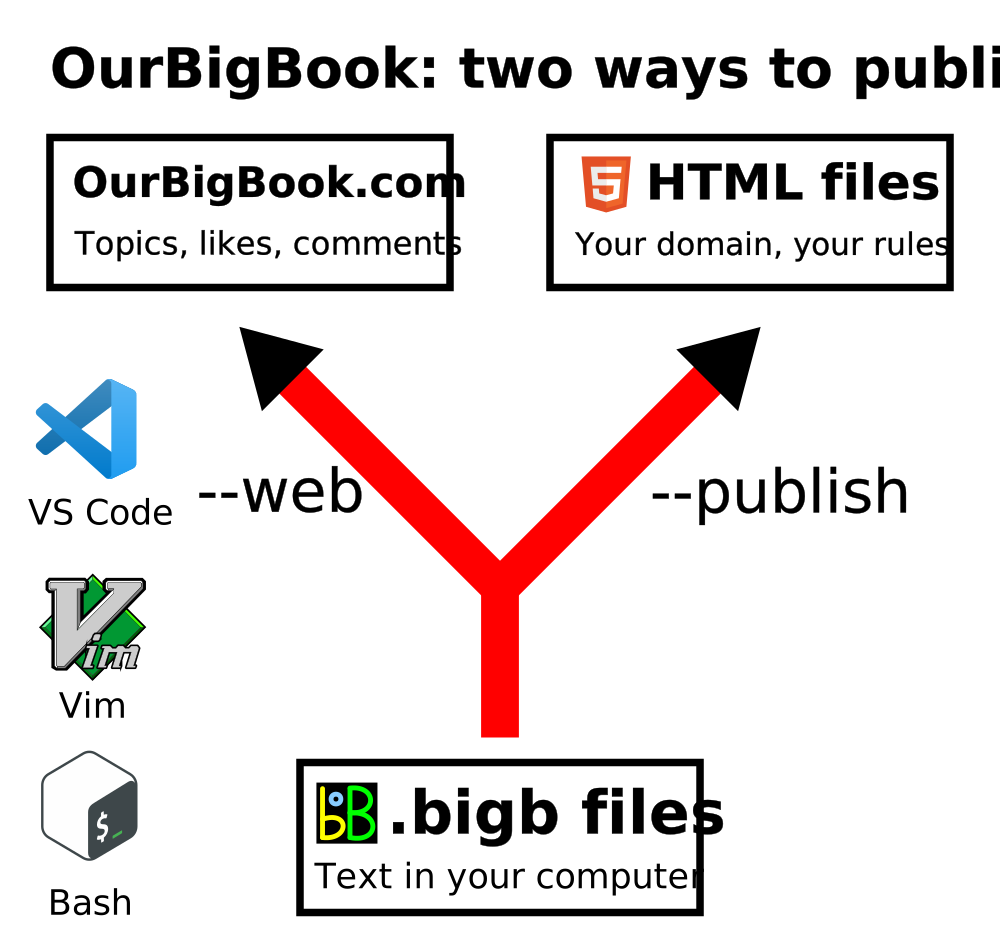
Figure 2. You can publish local OurBigBook lightweight markup files to either OurBigBook.com or as a static website.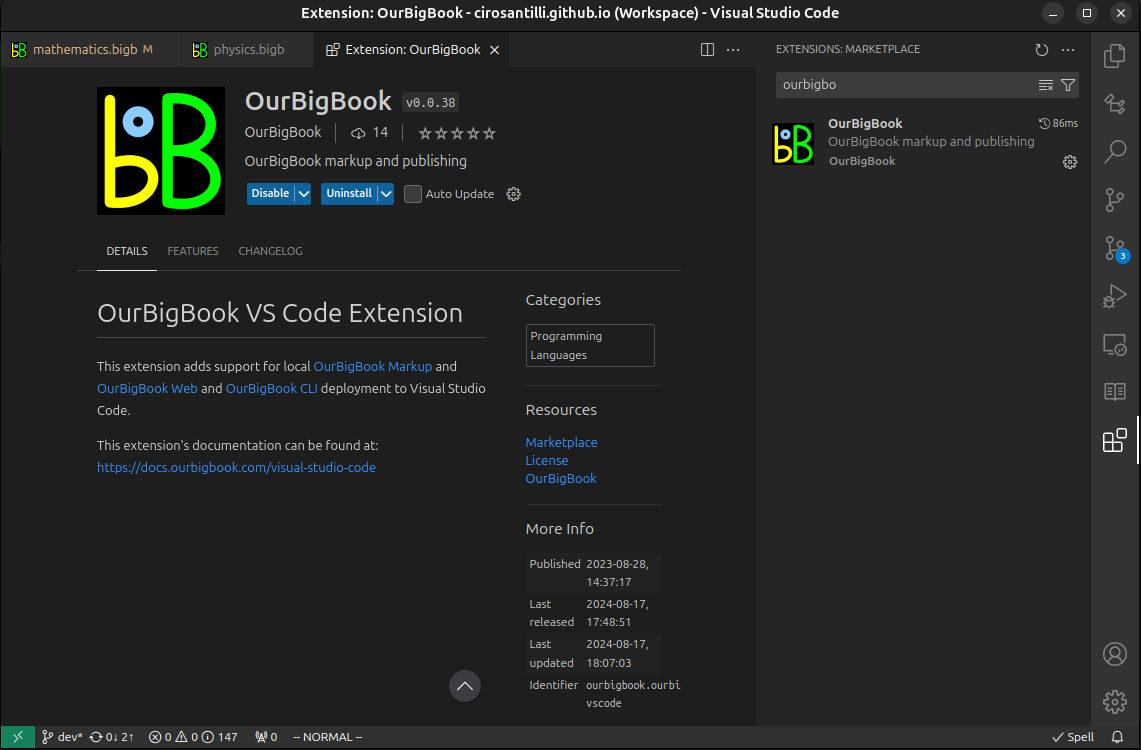
Figure 3. Visual Studio Code extension installation.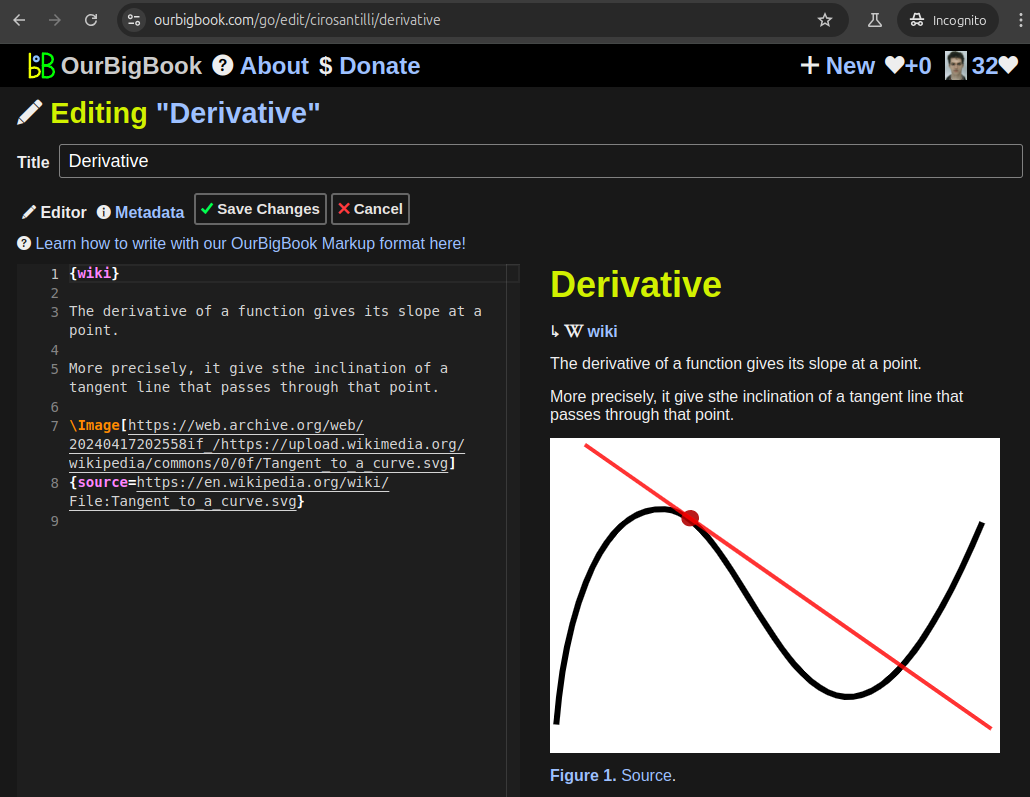
Figure 5. . You can also edit articles on the Web editor without installing anything locally. Video 3. Edit locally and publish demo. Source. This shows editing OurBigBook Markup and publishing it using the Visual Studio Code extension. 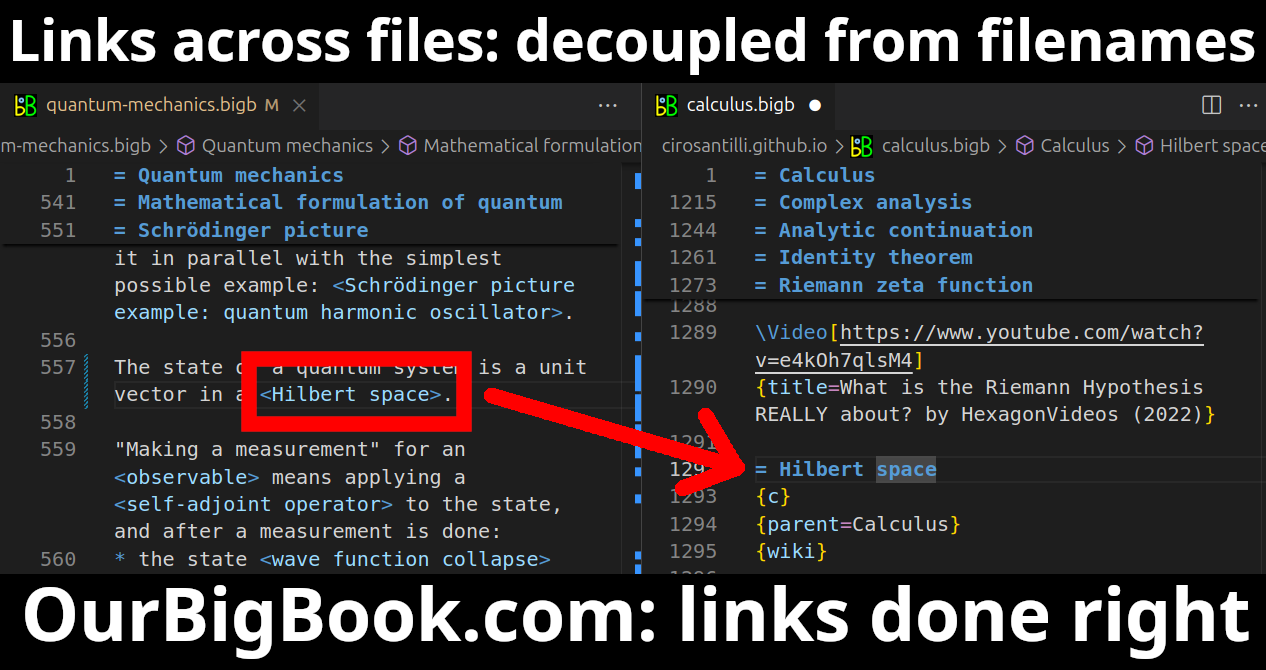
- Infinitely deep tables of contents:
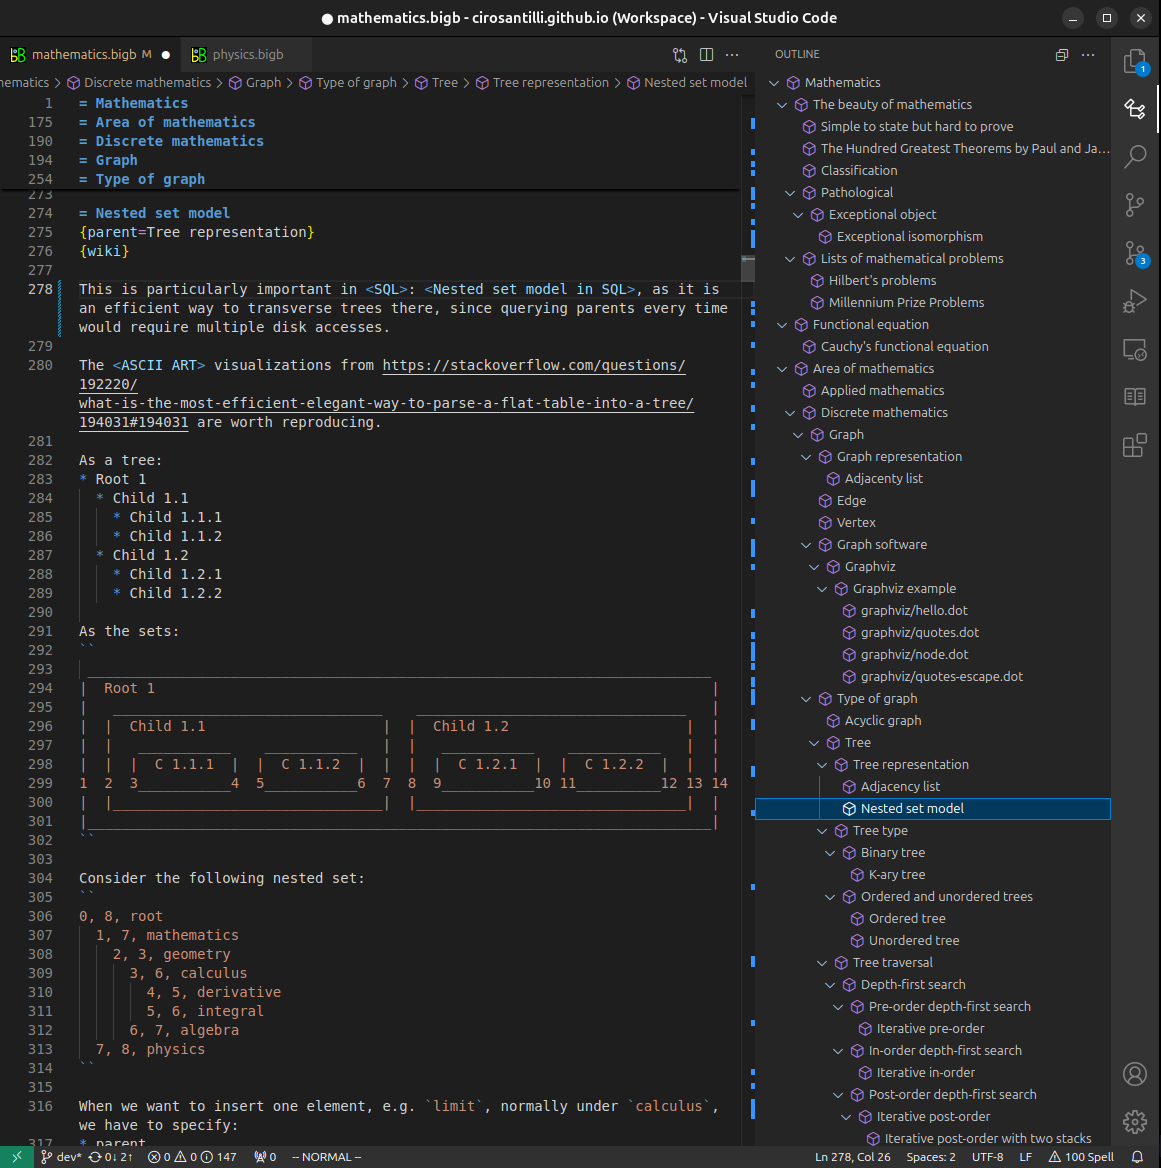
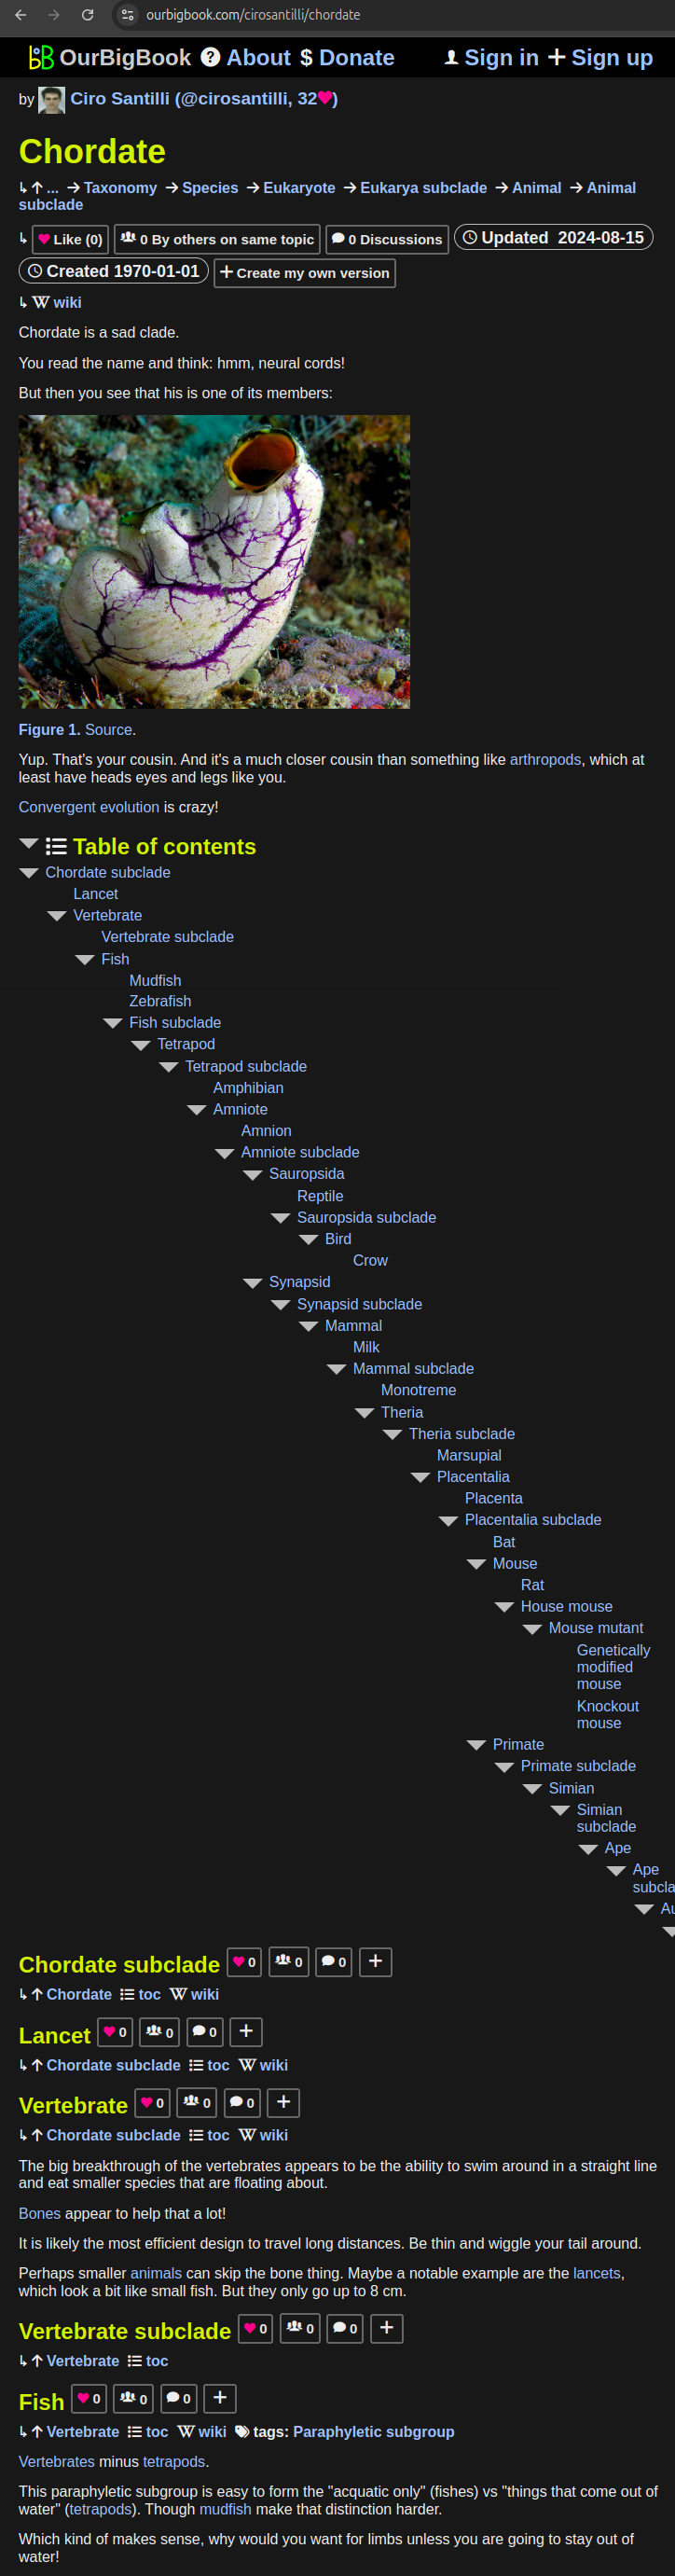
All our software is open source and hosted at: github.com/ourbigbook/ourbigbook
Further documentation can be found at: docs.ourbigbook.com
Feel free to reach our to us for any help or suggestions: docs.ourbigbook.com/#contact