Topics (203k) Articles (205k) Users (300) Discussions (237) Comments (383) Files (715) New article

Pontifex is a project associated with the development of a decentralized, blockchain-based system for addressing challenges in governance, community engagement, and decision-making. It often focuses on improving transparency, accountability, and efficiency within organizations or communities. The project may involve creating tools for voting, proposals, and civic participation that are secure and verifiable through blockchain technology.
Phase-field models are mathematical frameworks used to describe and simulate complex phase transitions and interfaces in various physical systems, such as materials science, fluid dynamics, and biophysics. Traditionally, these models involve a continuous space where the interfaces between different phases are represented by smooth transitions characterized by an order parameter, often a scalar field that varies continuously. When phase-field models are adapted to graphs, the framework changes significantly.
The phase-field model is a mathematical and computational framework used to describe the evolution of interfaces and the microstructural dynamics of materials. This concept is particularly prominent in materials science, fluid dynamics, and biological applications. The phase-field method allows for the modeling of complex phenomena involving phase transitions, such as solidification, grain growth, and fracture, by using a continuous field variable (the phase field) to represent different phases of the material.
A Patlak plot is a graphical analysis tool used primarily in the field of medical imaging, particularly in dynamic positron emission tomography (PET) studies. It is named after the researcher who developed it, Dr. Albert Patlak. The Patlak plot is used to analyze the kinetics of radiotracer uptake in tissues over time, helping to estimate parameters related to tissue perfusion and metabolic activity.
Particle-in-Cell (PIC) is a computational method used to simulate the dynamics of charged particles in a continuum electromagnetic field. It is particularly useful in plasma physics, space physics, and astrophysics, but can also be applied to other fields such as fluid dynamics and materials science.
PCLake is a platform designed for the analysis and management of Point Cloud data, which is often generated by 3D scanning technologies such as LiDAR (Light Detection and Ranging). Point clouds consist of a large number of points that represent the surfaces of objects in a three-dimensional space. PCLake enables users to visualize, manipulate, and analyze this data for various applications, such as geographic information systems (GIS), urban planning, environmental monitoring, and more.
OptimJ is a high-level optimization modeling language and environment designed for solving complex optimization problems. It allows users to formulate problems in a clear and concise manner, making it easier to describe mathematical models for various types of optimization tasks, such as linear programming, integer programming, and mixed-integer programming.
Open energy system models refer to computational frameworks and tools that are developed to analyze and simulate various aspects of energy systems, such as generation, distribution, consumption, and transition towards more sustainable practices. These models are typically characterized by their openness, meaning that they are publicly accessible, transparent, and often collaboratively developed.
The Open Energy Modelling Initiative (OEMI) is a collaborative effort aimed at promoting the open and transparent development of energy models and tools used for energy system analysis and policy making. The initiative emphasizes the importance of open-source software, open data, and community collaboration in the field of energy modeling. Key goals of the OEMI include: 1. **Transparency**: Encouraging the use of transparent methodologies and practices in energy modeling to enhance trust and reproducibility of results.
"Multislice" generally refers to a technique used in medical imaging, particularly in computed tomography (CT) scans. Multislice or multi-detector CT (MDCT) technology involves the use of multiple rows of detectors within the CT scanner. This allows for the acquisition of multiple slices of images in a single rotation of the imaging system, which significantly improves the speed of image acquisition and enhances image quality.
A multi-compartment model is a mathematical framework used to describe and analyze systems that can be divided into multiple interconnected compartments or segments. This modeling approach is widely used in various fields, including pharmacokinetics, ecology, and epidemiology, to represent how substances or populations move and interact within different compartments over time.
The mixed-mating model is a concept used in evolutionary biology and population genetics to describe the mating patterns within a population that exhibits both sexual and asexual reproduction. In such populations, individuals may reproduce in different ways: some may engage in sexual reproduction (mating with another individual), while others may reproduce asexually (without mating, often through processes like self-fertilization or clonal reproduction).
Minimum-distance estimation is a statistical technique used to estimate parameters of a model by minimizing the distance between theoretical predictions and observed data. It is particularly useful when dealing with models where traditional methods, such as maximum likelihood estimation, are difficult to apply or may not yield valid results. Here’s a basic outline of how minimum-distance estimation works: 1. **Distance Metric**: Define a distance metric that quantifies the discrepancy between the observed data and the model's predictions.
A microscopic traffic flow model is a detailed simulation approach used to represent the individual movements of vehicles and drivers in a traffic system. Unlike macroscopic models, which focus on aggregated traffic flow parameters like average speed, density, and flow rates, microscopic models analyze the behavior of each vehicle and driver in the traffic system.
Mathematical exposure modeling is a process used to assess and quantify the potential exposure of individuals or populations to certain hazards, risks, or substances. This modeling approach is commonly applied in various fields, including environmental science, public health, toxicology, occupational safety, and risk assessment. The key components of mathematical exposure modeling generally include: 1. **Identification of Hazards**: Identifying the agents, substances, or factors that may pose a risk (e.g., chemicals, pollutants, biological agents).
Malthusian equilibrium refers to a concept in population dynamics and economic theory derived from the work of the British economist and demographer Thomas Robert Malthus, particularly his 1798 work "An Essay on the Principle of Population." In this context, Malthusian equilibrium describes a state where a population's growth is balanced by the means of subsistence available in its environment, leading to a stable population size over time.
Macroscopic traffic flow models are used to describe and analyze the flow of traffic on a larger scale, often at the level of road networks or regions rather than individual vehicles. These models treat traffic as a continuous fluid rather than focusing on individual vehicles, and they typically use aggregate quantities such as traffic density, flow (the number of vehicles passing a point per unit time), and average velocity.
The Maas–Hoffman model, also known as the Maas-Hoffman dynamic model, is a theoretical framework used to analyze and understand the behavior of people and organizations in complex systems, often in the context of resource allocation and decision-making. Although the specific name may not be widely recognized across different fields, the model typically applies principles from operational research, economics, and systems dynamics.
MAgPIE, which stands for "Magneto-Optical Imaging of Photoelectrons," is often associated with research and techniques related to magneto-optical phenomena, particularly in the context of condensed matter physics and materials science. However, the term may also refer to a variety of specific projects or tools within these fields.
A Logan plot, also known as a Logan graphical analysis, is a graphical method used in pharmacokinetics and neuroimaging, particularly in the analysis of positron emission tomography (PET) data. It is primarily used to estimate the binding potential (BP) of radioligands, which are compounds that bind to specific receptors in the body. The Logan plot is particularly useful for analyzing reversible binding of a radioligand to its receptor.
Pinned article: Introduction to the OurBigBook Project
Welcome to the OurBigBook Project! Our goal is to create the perfect publishing platform for STEM subjects, and get university-level students to write the best free STEM tutorials ever.
Everyone is welcome to create an account and play with the site: ourbigbook.com/go/register. We belive that students themselves can write amazing tutorials, but teachers are welcome too. You can write about anything you want, it doesn't have to be STEM or even educational. Silly test content is very welcome and you won't be penalized in any way. Just keep it legal!
Intro to OurBigBook
. Source. We have two killer features:
- topics: topics group articles by different users with the same title, e.g. here is the topic for the "Fundamental Theorem of Calculus" ourbigbook.com/go/topic/fundamental-theorem-of-calculusArticles of different users are sorted by upvote within each article page. This feature is a bit like:
- a Wikipedia where each user can have their own version of each article
- a Q&A website like Stack Overflow, where multiple people can give their views on a given topic, and the best ones are sorted by upvote. Except you don't need to wait for someone to ask first, and any topic goes, no matter how narrow or broad
This feature makes it possible for readers to find better explanations of any topic created by other writers. And it allows writers to create an explanation in a place that readers might actually find it.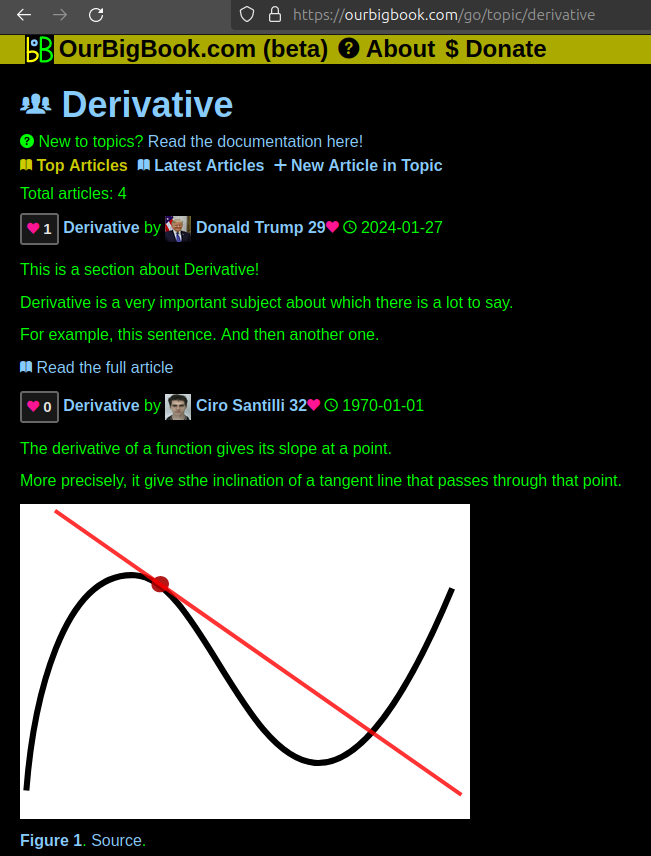
Figure 1. Screenshot of the "Derivative" topic page. View it live at: ourbigbook.com/go/topic/derivativeVideo 2. OurBigBook Web topics demo. Source. - local editing: you can store all your personal knowledge base content locally in a plaintext markup format that can be edited locally and published either:This way you can be sure that even if OurBigBook.com were to go down one day (which we have no plans to do as it is quite cheap to host!), your content will still be perfectly readable as a static site.
- to OurBigBook.com to get awesome multi-user features like topics and likes
- as HTML files to a static website, which you can host yourself for free on many external providers like GitHub Pages, and remain in full control
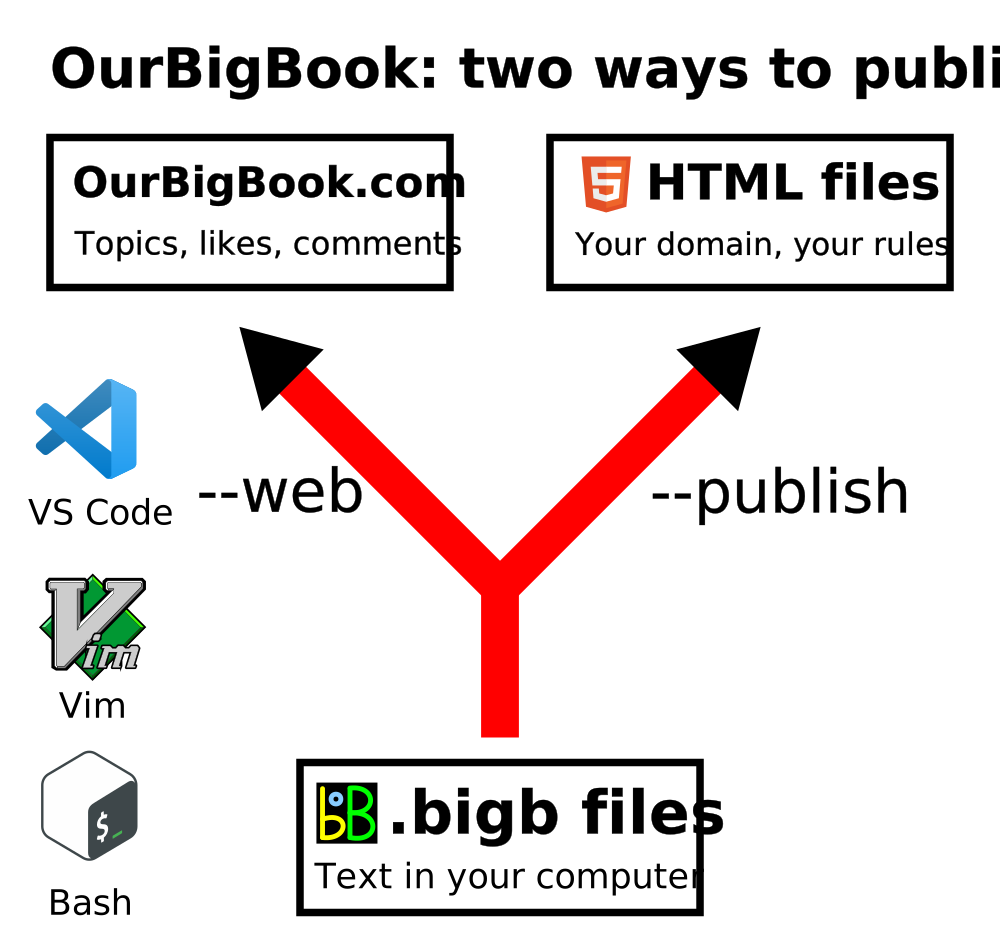
Figure 2. You can publish local OurBigBook lightweight markup files to either OurBigBook.com or as a static website.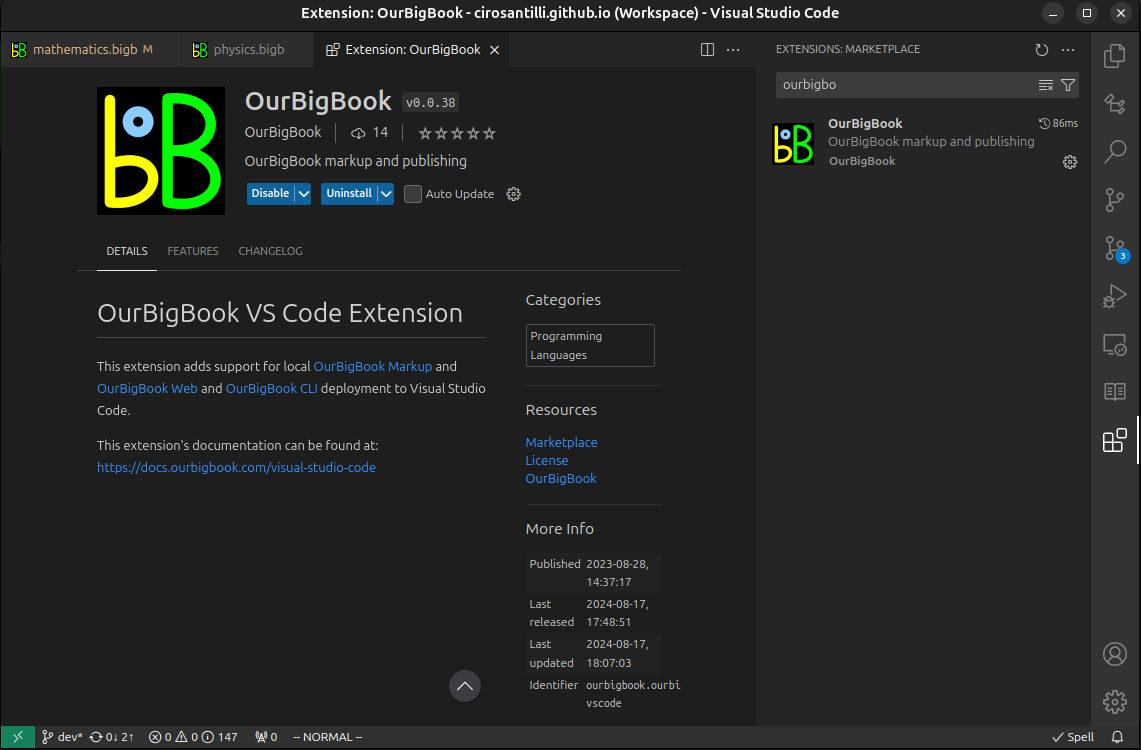
Figure 3. Visual Studio Code extension installation.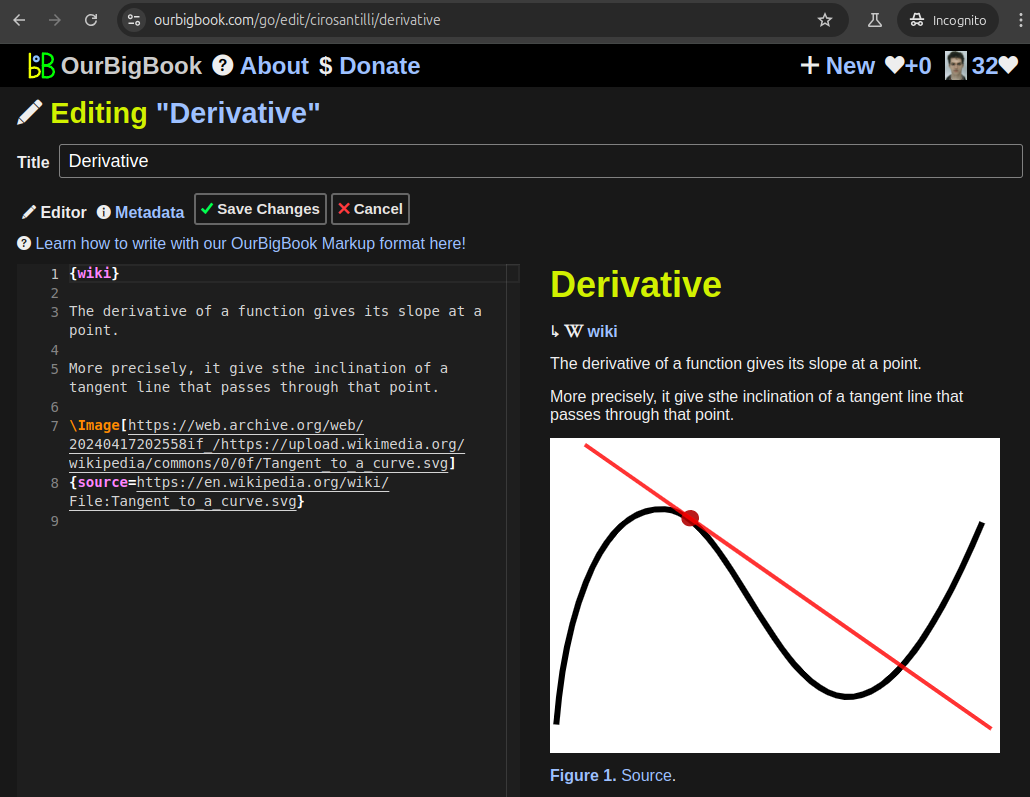
Figure 5. . You can also edit articles on the Web editor without installing anything locally. Video 3. Edit locally and publish demo. Source. This shows editing OurBigBook Markup and publishing it using the Visual Studio Code extension. 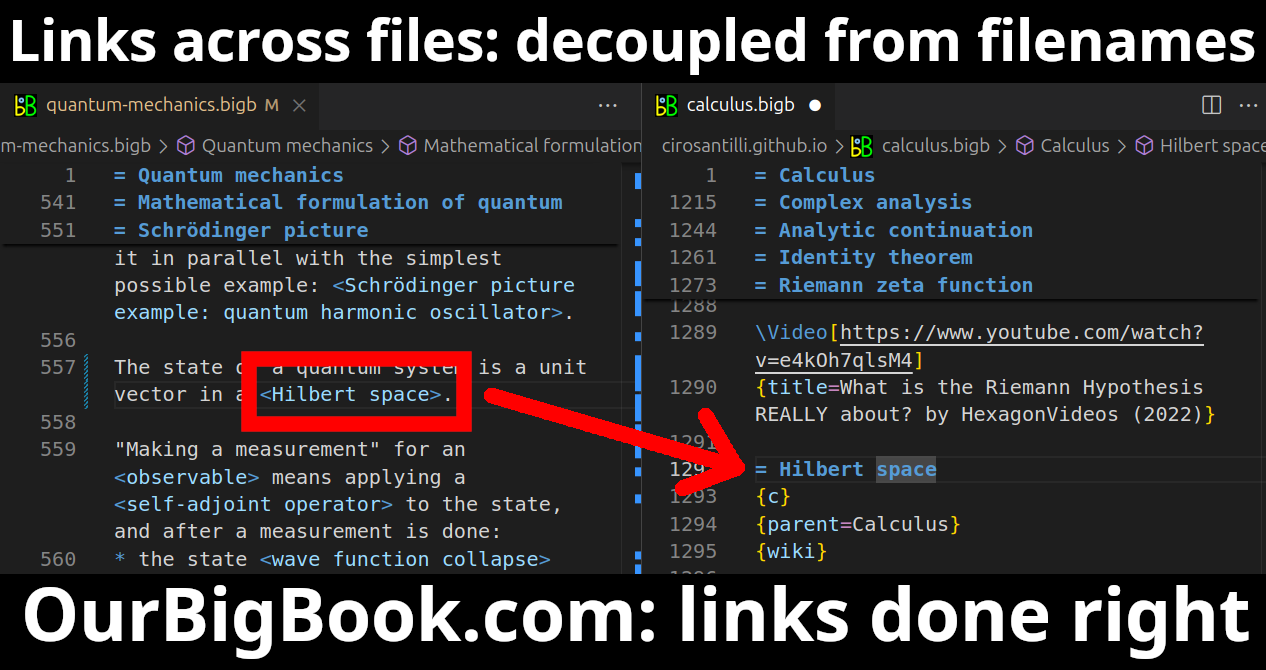
- Infinitely deep tables of contents:
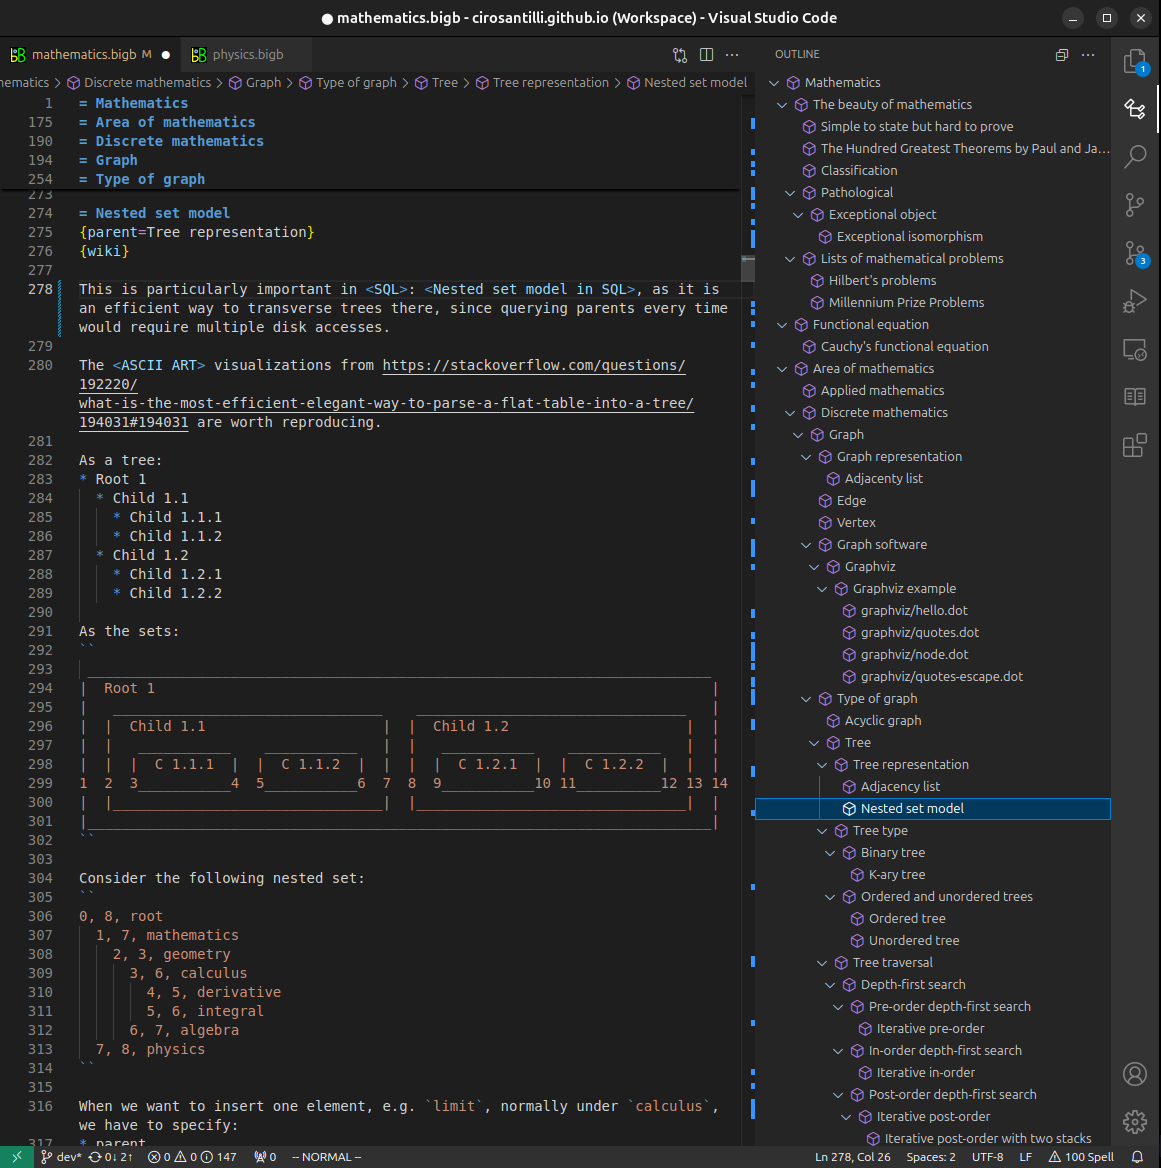
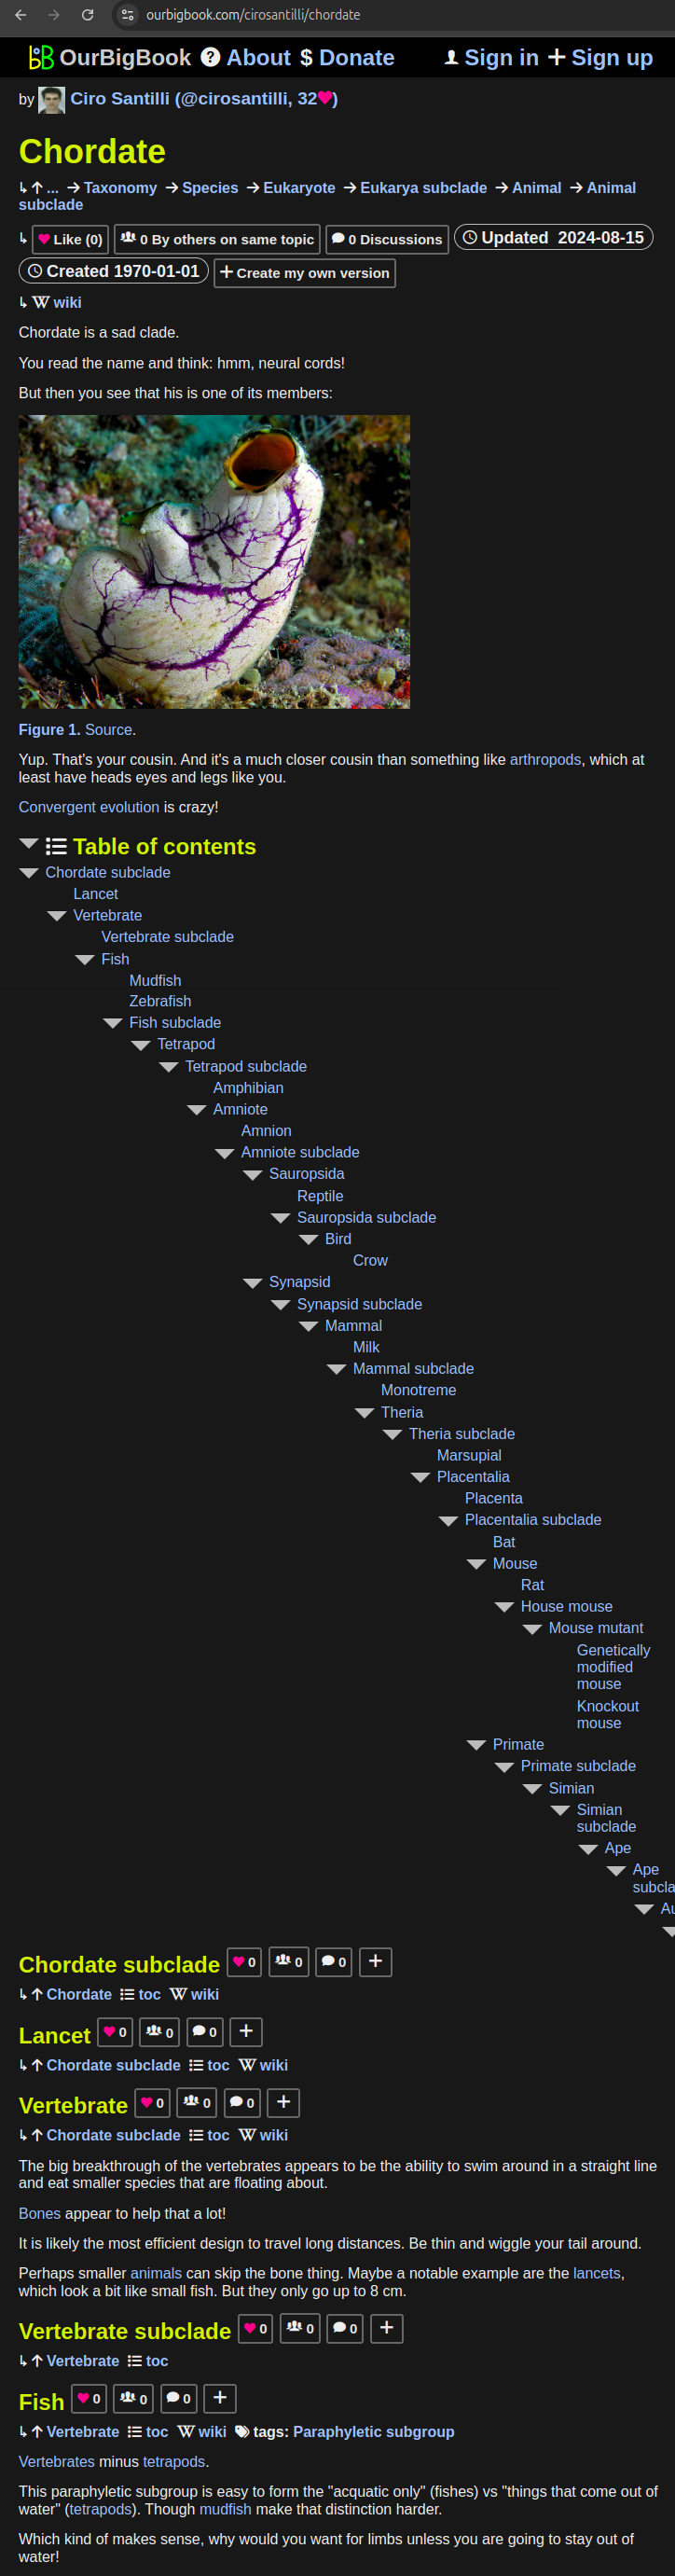
All our software is open source and hosted at: github.com/ourbigbook/ourbigbook
Further documentation can be found at: docs.ourbigbook.com
Feel free to reach our to us for any help or suggestions: docs.ourbigbook.com/#contact