Energy profile (chemistry)
ID: energy-profile-chemistry

An energy profile plots an explicitly specified energy against a reaction coordinate. Identify whether the vertical axis is potential energy, enthalpy, or Gibbs free energy; these descriptions are related but not interchangeable. A potential-energy profile describes a path through configurations, while a free-energy description also accounts for the relevant thermodynamic conditions.
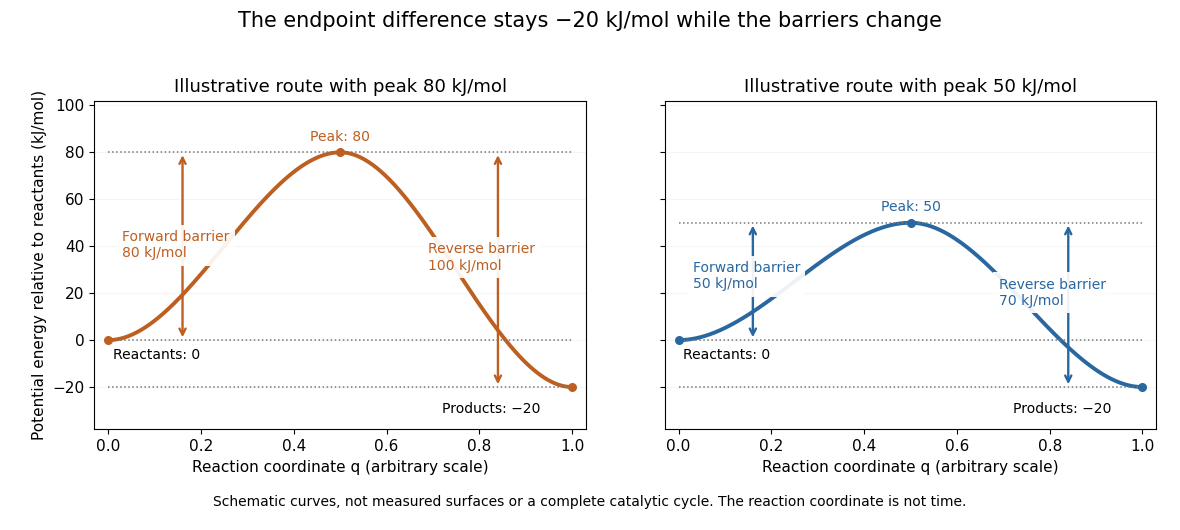
Two schematic potential-energy profiles share endpoints but have different barriers
. The reactant level is , the product level is , and the two maxima are and . These chosen curves illustrate endpoint differences and barrier heights; they are not measured surfaces, trajectories in time, or a complete catalytic cycle. Details.
For the two chosen profiles, the reaction energy barriers from the reactants are and . From the reaction products, the same maxima are and higher. Both paths have endpoint difference . The barrier is measured from the relevant starting endpoint, not from an arbitrary zero of potential energy.
The appeal of the diagram is that it separates two useful questions: which endpoint is lower, and which path is easier to traverse? Catalysis changes the route through transition states while retaining the endpoint thermodynamics of the same overall chemical reaction. A real catalytic route may have several steps and reaction intermediates; the two simple curves do not specify such a reaction mechanism. The plotted potential-energy difference alone is not an equilibrium constant or a calculated rate constant. See Chemistry 2e, 12.7: alternative reaction routes and catalysis.
New to topics? Read the docs here!