A reaction coordinate parametrizes changes in molecular configuration along a chemical reaction path. It can involve a bond length, a bond angle, or a combination of geometric changes. It is not elapsed time and is not the bulk extent of reaction: one describes configurations, while the other accounts for how much material has converted. The precise choice matters when interpreting an energy profile. See the IUPAC Gold Book: reaction coordinate.
A hypersurface separating selected reactant and product regions. A rate derived from signed flux and a suitable long-time commitment is independent of its location when the dynamics and normalization are treated consistently.
A potential energy surface assigns potential energy to the configurations of the reacting chemical atoms, for a specified electronic description. A reaction coordinate selects a path through this many-dimensional configuration space; a potential-energy profile then records the potential energy along that path. Different paths can share endpoints but cross different barriers. See the IUPAC Gold Book: potential-energy reaction surface.
A correlation between many-electron states classified by total spin and spatial symmetry along a nuclear path. Orbital occupations, spin adaptation and configuration interaction are needed; one-electron energy curves alone are not a state diagram.
A degeneracy between adiabatic electronic states with characteristic splitting in suitable nuclear-coordinate directions. It can connect to Jahn-Teller dynamics in open-shell triangular molecules.
An energy profile plots an explicitly specified energy against a reaction coordinate. Identify whether the vertical axis is potential energy, enthalpy, or Gibbs free energy; these descriptions are related but not interchangeable. A potential-energy profile describes a path through configurations, while a free-energy description also accounts for the relevant thermodynamic conditions.
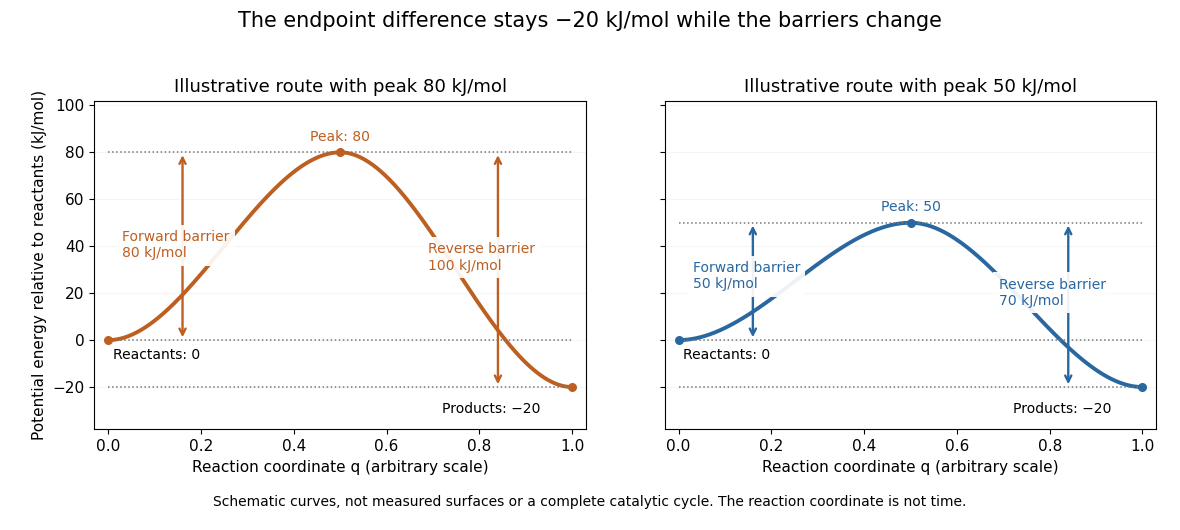
Two schematic potential-energy profiles share endpoints but have different barriers
. The reactant level is , the product level is , and the two maxima are and . These chosen curves illustrate endpoint differences and barrier heights; they are not measured surfaces, trajectories in time, or a complete catalytic cycle. Details.For the two chosen profiles, the reaction energy barriers from the reactants are and . From the reaction products, the same maxima are and higher. Both paths have endpoint difference . The barrier is measured from the relevant starting endpoint, not from an arbitrary zero of potential energy.
The appeal of the diagram is that it separates two useful questions: which endpoint is lower, and which path is easier to traverse? Catalysis changes the route through transition states while retaining the endpoint thermodynamics of the same overall chemical reaction. A real catalytic route may have several steps and reaction intermediates; the two simple curves do not specify such a reaction mechanism. The plotted potential-energy difference alone is not an equilibrium constant or a calculated rate constant. See Chemistry 2e, 12.7: alternative reaction routes and catalysis.
A plot of Gibbs free energy along a specified reaction coordinate under stated conditions. A barrier must be measured from the appropriate starting minimum.
A potential-energy profile plots the potential energy of the reacting system along a specified path from reactants through a transition state to reaction products. It is a particular kind of energy profile. For an elementary reaction, a suitable reaction coordinate parametrizes the path; a multi-step reaction mechanism needs the coordinates of its successive steps. See the IUPAC Gold Book: potential-energy profile.
A reaction energy barrier is the height of a specified peak relative to the starting state in an energy profile. State which energy is used and which direction is being considered. A schematic barrier is not automatically the empirical activation energy obtained from the temperature dependence of a rate constant.
Articles by others on the same topic


A reaction coordinate is a concept used in chemistry and physics to describe the progress of a chemical reaction as it proceeds from reactants to products. It is often represented as a one-dimensional plot that captures changes in energy over the course of the reaction. The reaction coordinate typically represents the arrangement of atoms and the potential energy of the system, illustrating how the reactants transition through an intermediate state (if applicable) to form the products.