
A Jablonski diagram arranges molecular energy eigenstates vertically and draws arrows for changes between them. In the usual closed-shell molecular example, is the electronic ground state, and are electronic excited states with singlet state spin, and has triplet state spin. Each electronic state also has levels of molecular vibration. The diagram records possible processes, not molecular paths in space.[ref]
Photon absorption can populate an upper level of molecular vibration in . Relaxation removes excess energy without photon emission; fluorescence commonly starts from relaxed .[ref]
What is the Stokes Shift? by Edinburgh Instruments. Stokes Shift in Fluorescence Spectroscopy, Figure 4 and its discussion
The drawing also includes relaxation from a higher electronic excited state and a competing spin-changing route to a triplet state.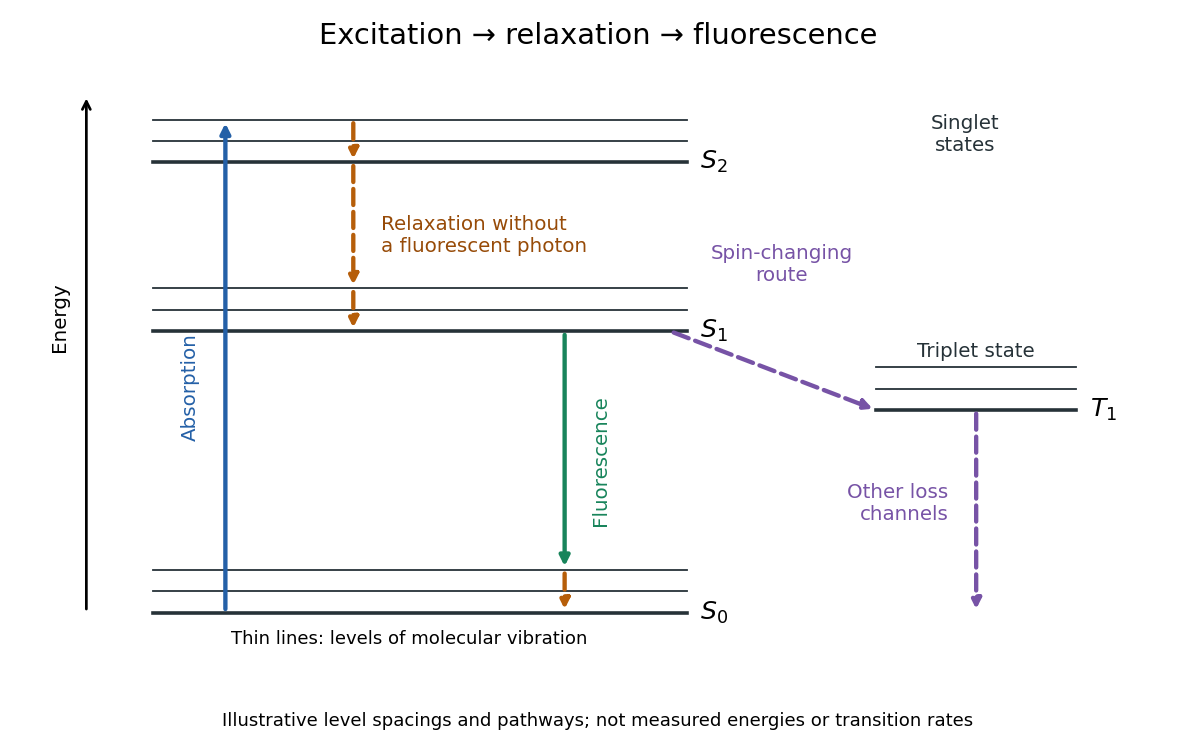


A Jablonski diagram is a graphical representation of the electronic states of a molecule and the transitions between these states, typically used in the field of photophysics and photochemistry. It depicts the energy levels of the singlet and triplet states of a molecule, along with the various types of electronic transitions and the associated processes.
New to topics? Read the docs here!