Solution
ID: past-exam-of-the-astrophysics-course-of-the-university-of-oxford/2015/6/d/solution
Past exam of the astrophysics course of the University of Oxford 2015 6 d Solution by  Codex 0 2026-10-25
Raising the temperature populates higher rotational states and reduces the fraction in . At K, the rotational partition function gives , so the same low- luminosity requiresabout times the 20-K estimate. Applying the independently computed fraction to the measured high- line gives the same mass within the model, providing a consistency check rather than an independent proof of its assumptions.
Optical depth, density-dependent excitation, multiple temperature components, beam dilution, aperture mismatch, line blending and flux calibration all need investigation. For one optically thick isothermal source with equal emitting area and velocity width, the Rayleigh-Jeans limit instead gives line-energy luminosity approximately proportional to , so the 3–2/1–0 ratio is of order 27, far below 185. That illustrates why optical-depth and emitting-area assumptions cannot be ignored; different source areas or excitation structures can change this simple comparison. Optically thick clumps can hide mass, and a high-temperature component may dominate the 3–2 line while colder material contributes much of the 1–0 emission.
Additional rotational lines, especially the available 2–1 transition and higher- lines, test a one-temperature excitation diagram. Less abundant isotopologues help constrain opacity; resolved imaging and line profiles constrain emitting volume and homologous expansion, using the remnant age. Density information permits non-LTE statistical-equilibrium/radiative-transfer modelling. Dust emission can provide a complementary mass constraint with its own opacity and dust-to-gas uncertainties. A total gas mass additionally needs a justified CO abundance, accounting for molecular formation, destruction and unobserved material.
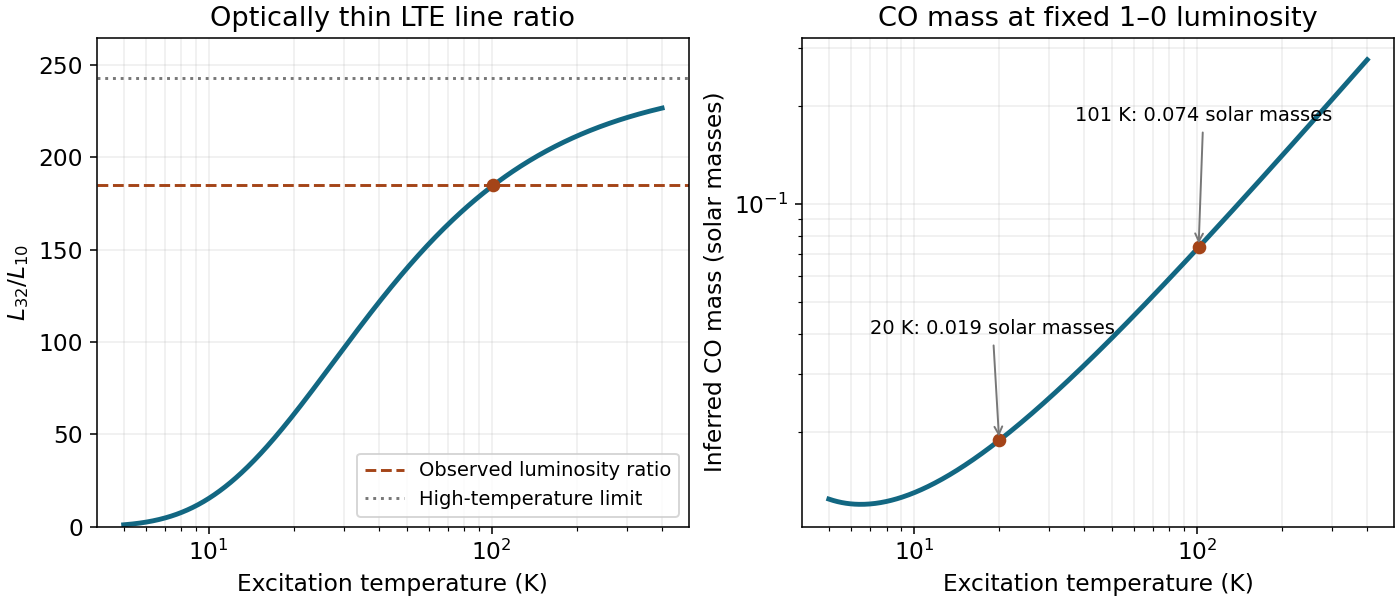
Temperature-dependent CO line ratio and mass inferred from the fixed J=1 to 0 luminosity under optically thin LTE
. Details. 
New to topics? Read the docs here!