Solution
ID: past-exam-of-the-materials-science-course-of-the-university-of-cambridge/2016/paper-1/4/b/solution
Past exam of the materials science course of the University of Cambridge 2016 Paper 1 4 b Solution by  Codex 0 2026-10-20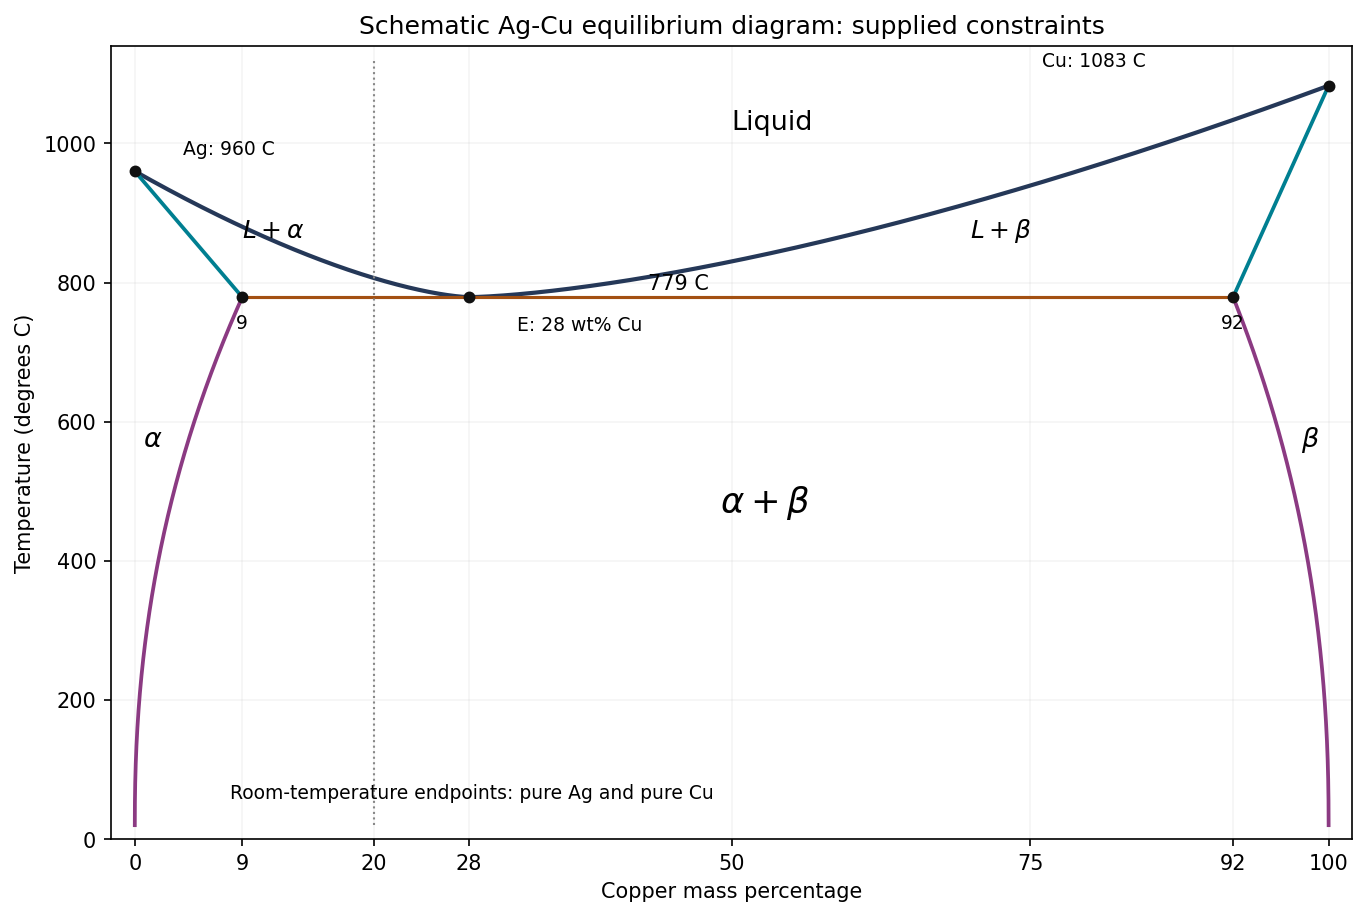
Original schematic Ag-Cu phase diagram constrained by the supplied endpoints and eutectic tie line; unprovided curve shapes and intermediate temperatures are illustrative
. Details. 
The horizontal axis is copper mass percentage. The two liquidus branches meet at and connect to pure silver at and pure copper at . The terminal solid-solution boundaries at the eutectic temperature are Cu for and Cu for . Label the single-phase fields , the two liquid-plus-solid fields , and the lower two-solid field .
The solidus boundaries link the pure-component melting points to their terminal solubility limits; the eutectic isotherm spans the three-phase tie line. Below it, the solvus branches approach pure Ag and pure Cu at room temperature. The supplied data determine this topology and the marked points, not the exact shapes of every boundary. The drawing therefore does not invent a numerical liquidus temperature for an intermediate composition.
New to topics? Read the docs here!