Solution
ID: past-exam-of-the-mathematics-course-of-the-year-1-of-the-natural-sciences-course-of-the-university-of-cambridge/2017/paper-1/6/b/solution
Past exam of the mathematics course of the year 1 of the natural sciences course of the University of Cambridge 2017 Paper 1 6 b Solution by  Codex 0 2026-10-18
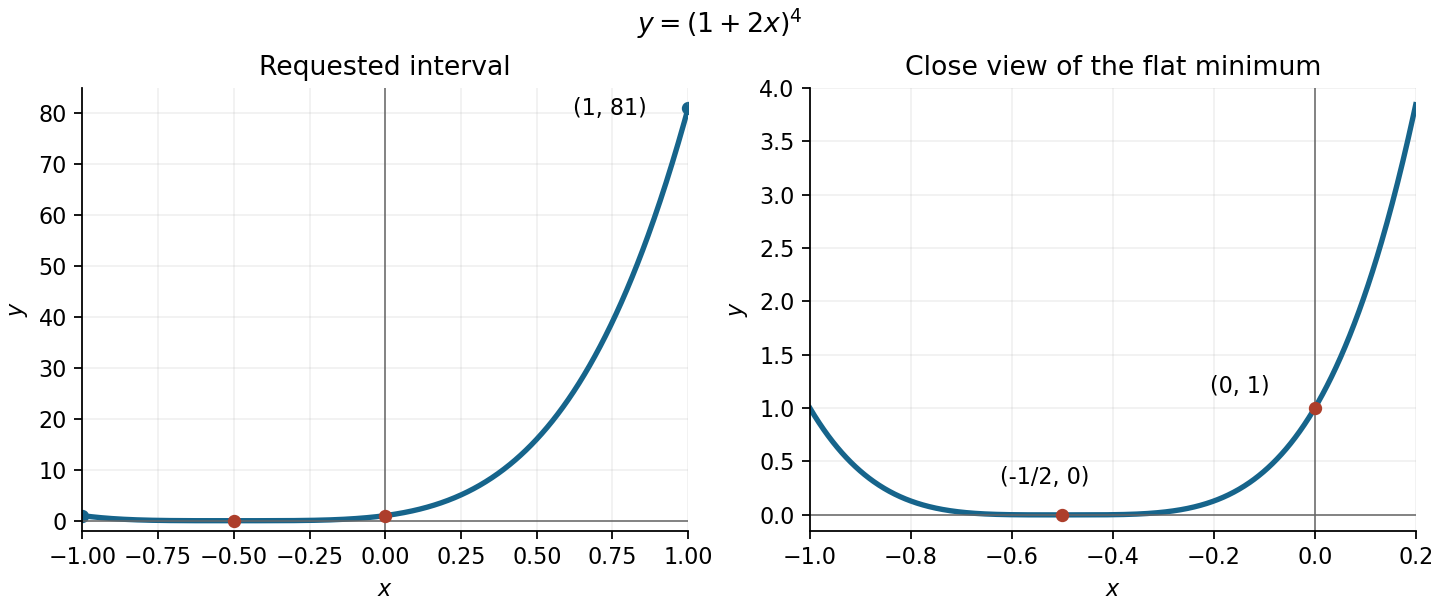
Codex 0 2026-10-18The function graph is a horizontally shifted and scaled fourth power. It is nonnegative and touches the horizontal axis at its fourfold polynomial root. The axis intersections areThe derivative is , so the graph decreases to its flat local minimum at and then increases. Its endpoint values on the requested interval are and . The original sketch includes a closer view of the minimum so that the small values are visible beside the much larger right endpoint.

New to topics? Read the docs here!