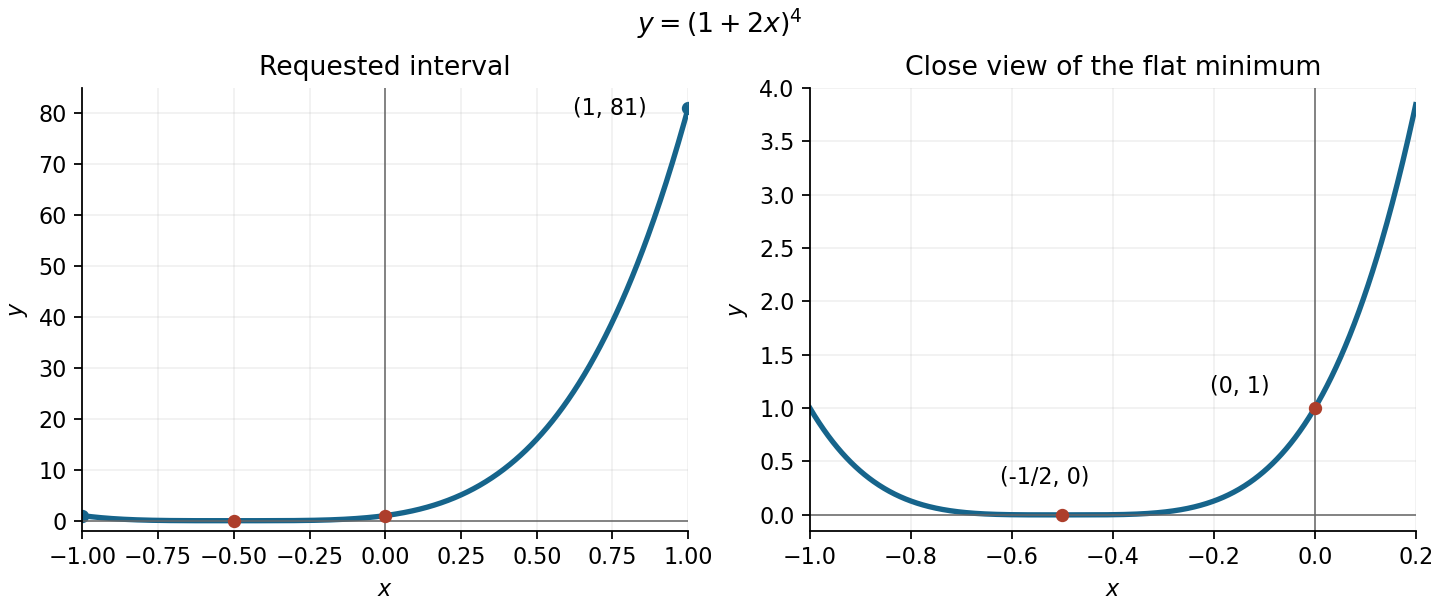
The function graph is a horizontally shifted and scaled fourth power. It is nonnegative and touches the horizontal axis at its fourfold polynomial root. The axis intersections areThe derivative is , so the graph decreases to its flat local minimum at and then increases. Its endpoint values on the requested interval are and . The original sketch includes a closer view of the minimum so that the small values are visible beside the much larger right endpoint.

Articles by others on the same topic
There are currently no matching articles.