
A time series is a sequence of observations indexed by time: hourly temperatures, daily sales, or successive measurements of a fluctuating signal. A probabilistic model treats these observations as one sample path of a stochastic process . For equally spaced observations, take and measure a lag of a time series in observation intervals. The order matters: shuffling a record preserves its observed values but destroys information about how one value follows another.
Two basic ways to model temporal dependence are an autoregressive model, which feeds past observations into the next value, and a moving-average model, which combines present and past white noise. An AR(1) carries a disturbance forward with diminishing weights; an MA(1) carries it into just two observations. Their autocorrelation functions make this difference visible. A weakly stationary process supplies a common mean and a lag-dependent autocovariance with which to describe that dependence.
These models help forecast future observations and quantify the uncertainty of averages. Successive measurements need not provide as much information as the same number of independent random variables: the long-run variance of a stationary process accounts for their accumulated covariances. Trend and seasonality require attention before fitting a stationary model; differencing and a seasonal difference operator can help, but do not automatically make every process stationary. See Peter Bartlett, Introduction to Time Series Analysis, lecture 1: objectives and models.
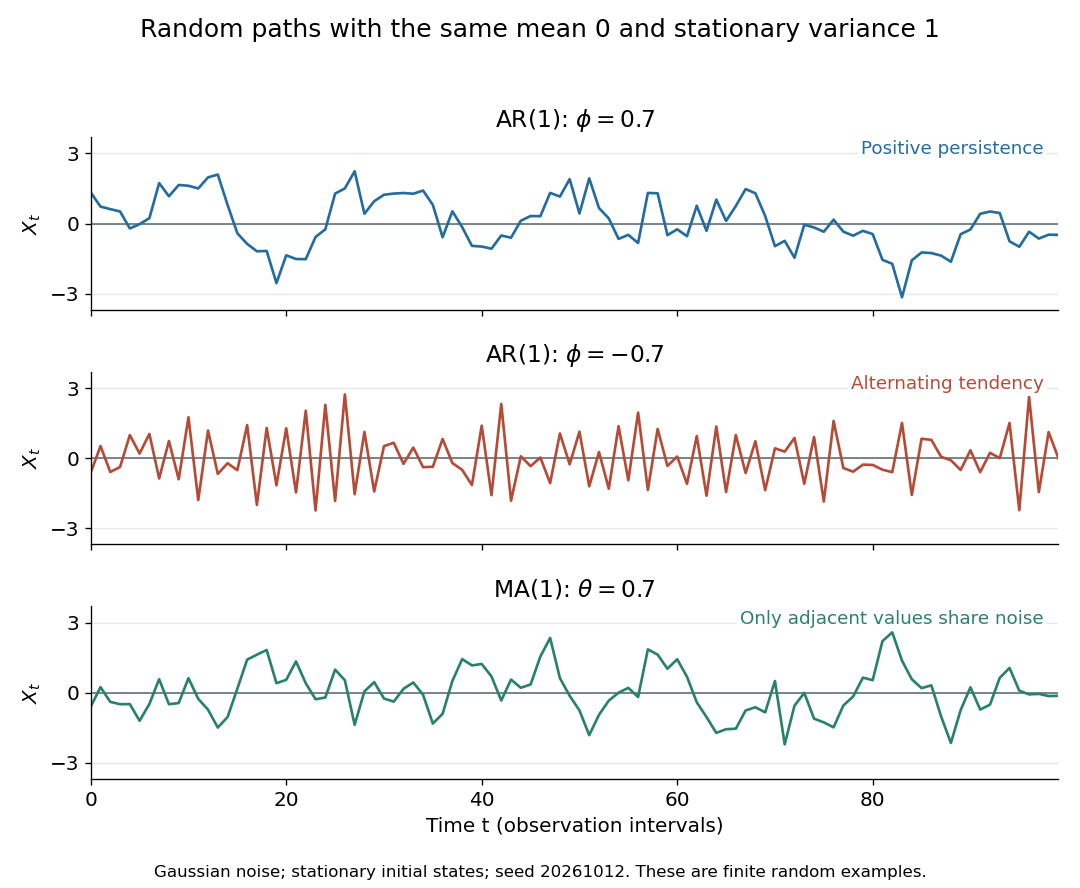
Stationary Gaussian examples: positive AR(1) persistence, negative AR(1) alternation, and MA(1) short memory
. Details. The three illustrated sample paths have zero mean and unit variance, so the visual comparison concerns dependence rather than scale. The AR(1) paths start from their stationary normal distribution, independently of future discrete Gaussian white noise; the MA(1) path includes the noise preceding its first observation. These are finite random examples, not exact pictures of an ACF. Compare their theoretical autocorrelation functions in autocorrelation.
Historically, Yule's 1927 study investigated disturbed periodicities in sunspot observations; it should not be read as the discovery of the particular AR(1) examples here. Slutsky studied how summing random inputs could produce wave-like records, a warning against inferring a periodic cause from appearance alone. The editorial note to his 1937 English paper identifies the 1927 Russian original. See G. Udny Yule, On a method of investigating periodicities in disturbed series, with special reference to Wolfer's sunspot numbers (1927) and Eugen Slutsky, The Summation of Random Causes as the Source of Cyclic Processes (1937), including the editorial note on the 1927 original.


A time series is a sequence of data points recorded or measured at successive points in time, typically at uniform intervals. It is a common method in statistics and various fields, such as finance, economics, environmental science, and engineering, for analyzing trends, patterns, and behaviors of data over time. Key characteristics of time series data include: 1. **Temporal Order**: The data points are ordered chronologically. Each observation has a timestamp, and the order matters.
New to topics? Read the docs here!