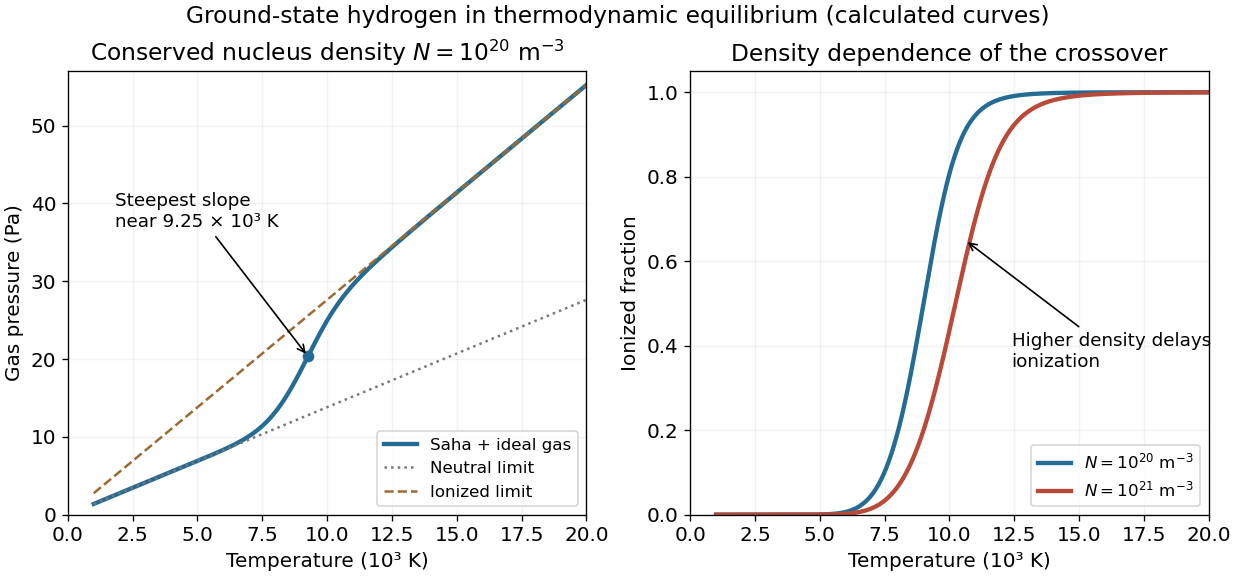
The held
graph is legible. Representative
readings are
P(5000K)≃6.8Pa and
P(15000K)≃41.4Pa, with readout
uncertainties of roughly
0.3–
0.5Pa and about
100K. They give
N≃P/(kBT) on the neutral branch and
N≃P/(2kBT) on the ionized branch, respectively. Both are consistent with
The error is
a conservative
graph-
reading estimate, not
a fitted experimental
confidence interval.
For that
density, the
Saha equation gives
x≃0.50 at
9000K,
x≃0.81 at
10000K, and
x≃0.9992 at
15000K. Differentiating the
ionization relation gives
x′=2−xx(1−x)(2T3+kBT2R),P′=NkB(1+x+Tx′).
The calculated maximum
slope occurs near
9.25×10³K, consistent with the source'
s visibly steepest region at roughly
(9.3±0.4)×103K. This checks the actual
slope rather than identifying it without justification with exactly half
ionization.