Gunnar Fant developed acoustic models connecting the physical production of speech to its measurable signal. His Acoustic Theory of Speech Production by Gunnar Fant relates vocal-tract geometry to acoustic behavior, including calculations based on X-ray studies of articulations. The original book dates to 1960; the inspected publisher preview is its 1970 second printing.[ref]
His source-filter model of speech production separates excitation from the filtering of the vocal tract. Changing a filter's resonances can move formants without requiring the same change in the fundamental frequency of the source. This makes speech synthesis an experimental tool: a researcher can vary model parameters and compare the generated signal with recorded speech. KTH's account explicitly describes his synthesis work as a means of testing production hypotheses.[ref]
Human Speech and Communication at KTH. research history, Fant and the experimental role of synthesis
KTH's curriculum vitae records 1919–2009 and his leadership of the Speech Transmission Laboratory from 1951 to 1966.[ref]


https://commons.wikimedia.org/wiki/File:Gunnar_Fant.jpg. Wikimedia Commons file record, named subject and institutional credit
Licensed CC BY-SA 3.0.David Weenink co-created Praat with Paul Boersma, providing tools for measuring and modeling speech. His 2006 thesis investigated speaker-adaptive vowel identification: how recognition can remain useful when acoustic patterns vary between speakers.[ref]
Praat: doing phonetics by computer by Paul Boersma and David Weenink. Intro, authorship
[ref]The thesis describes recordings from 30 speakers, each producing 12 Dutch vowels in controlled sentence frames. It relates these data to formants, principal component analysis, discriminant analysis and adaptive classification methods. This makes the recognition problem experimentally concrete: a classifier must separate vowel identity from speaker-related variation rather than memorize a single speaker's frequency spectrum.[ref]
Speaker-adaptive vowel identification by David Weenink. Chapters1–3 and11;30-speaker/12-vowel data description
Homepage: www.fon.hum.uva.nl/david/

Paul Boersma is a phonetician who co-created Praat with David Weenink. His work connects acoustic measurements to computational methods, including the estimation of fundamental frequency from sampled speech.[ref]
Praat: doing phonetics by computer by Paul Boersma and David Weenink. Intro, authorship
His 1993 periodicity-analysis paper examines how signal sampling and a finite analysis window affect estimates based on autocorrelation. Repetition produces peaks at nonzero time lags; locating a suitable peak gives a candidate period, while the relative peak height contains information about periodicity. Correcting the influence of the analysis window is important before interpreting those peaks as properties of the original signal.[ref]
Accurate short-term analysis of the fundamental frequency and the harmonics-to-noise ratio of a sampled sound by Paul Boersma. Sections1–3: autocorrelation, windowing and pitch-period estimation
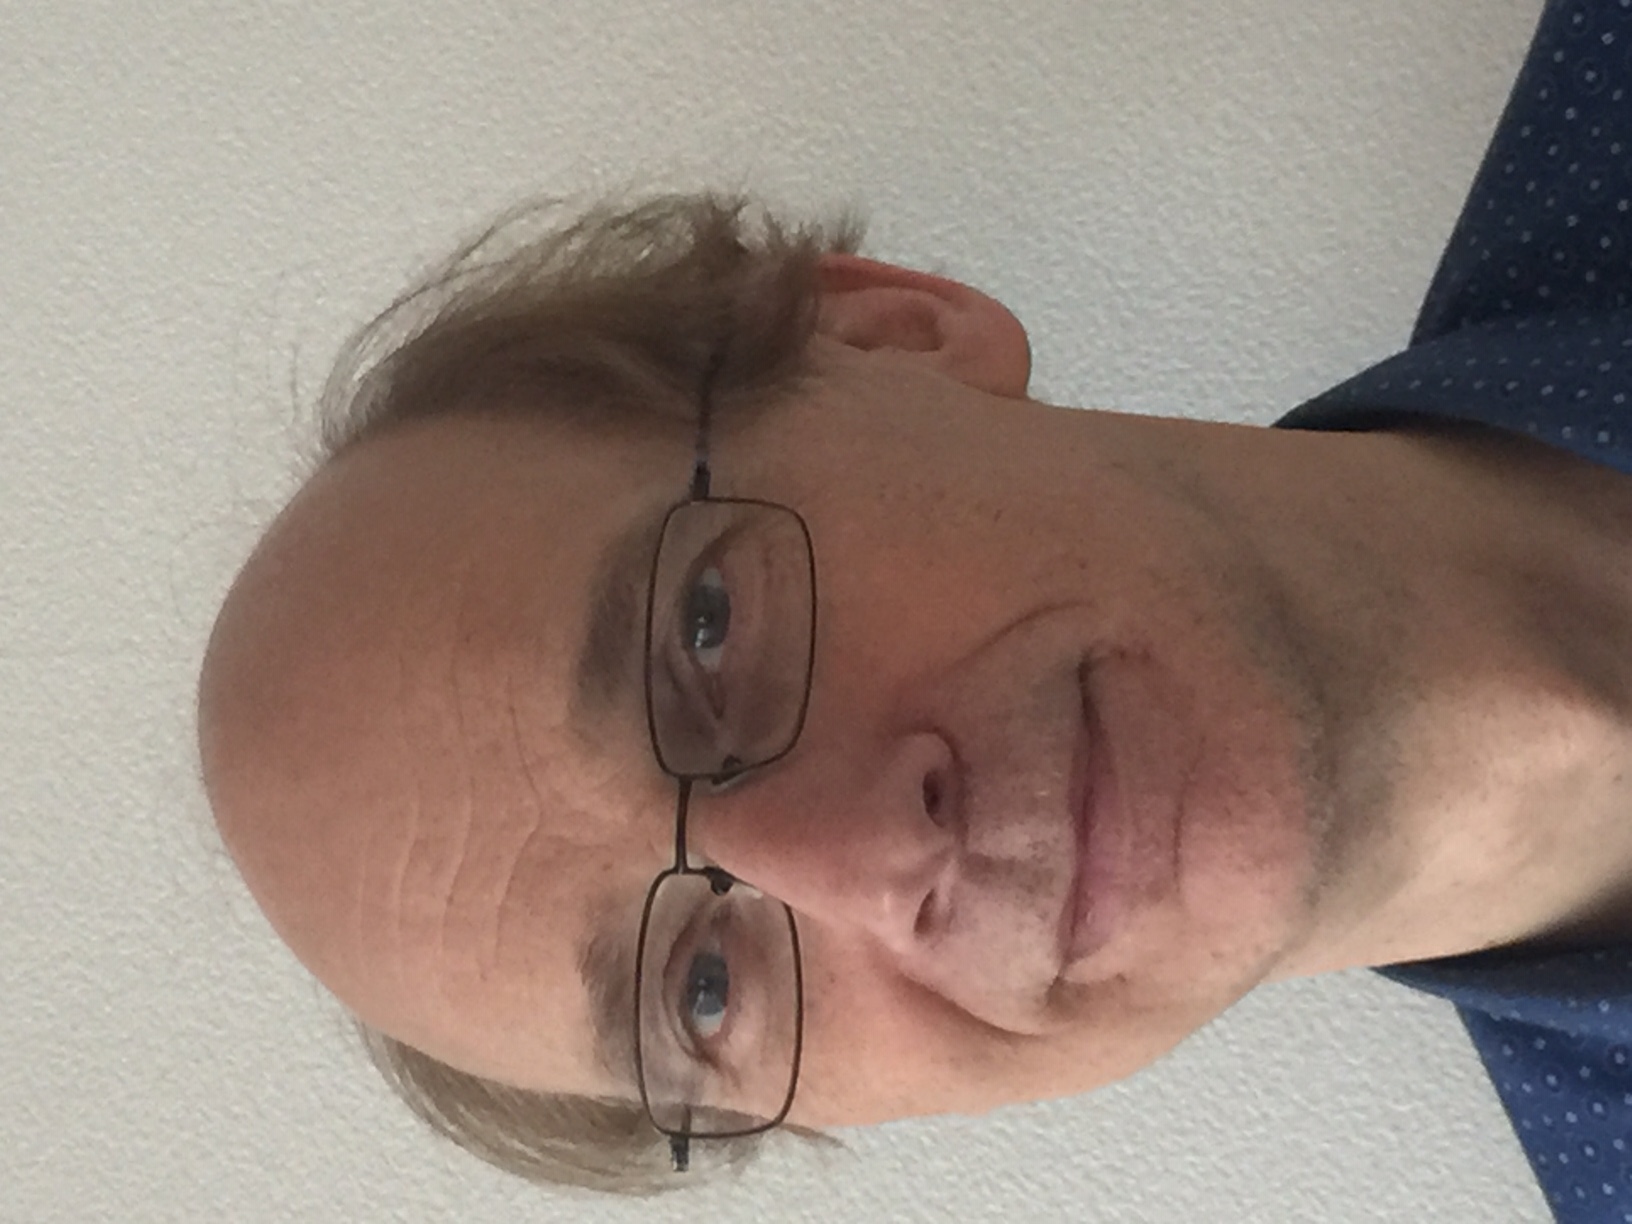
Homepage: www.fon.hum.uva.nl/paul/
- Accurate short-term analysis of the fundamental frequency and the harmonics-to-noise ratio of a sampled sound by Paul Boersma
- Annotation in the Praat Manual by Paul Boersma
- Formant Analysis in the Praat Manual by Paul Boersma
- Listening Experiments in the Praat Manual by Paul Boersma
- Pitch Analysis in the Praat Manual by Paul Boersma
- Praat: doing phonetics by computer by Paul Boersma and David Weenink
- Source-filter synthesis in the Praat Manual by Paul Boersma
- Spectral Analysis in the Praat Manual by Paul Boersma
Articles by others on the same topic
There are currently no matching articles.