For , put . The influence function of the mean, influence function of the sample median, and influence function of a Huber location estimator with fixed are respectivelyThe first grows without bound, the second jumps at the median, and the third clips continuously. For , and the normalized Huber tail is about . This illustrates the optimal bounded influence function for normal location without asserting that this cutoff is optimal for every contamination model.
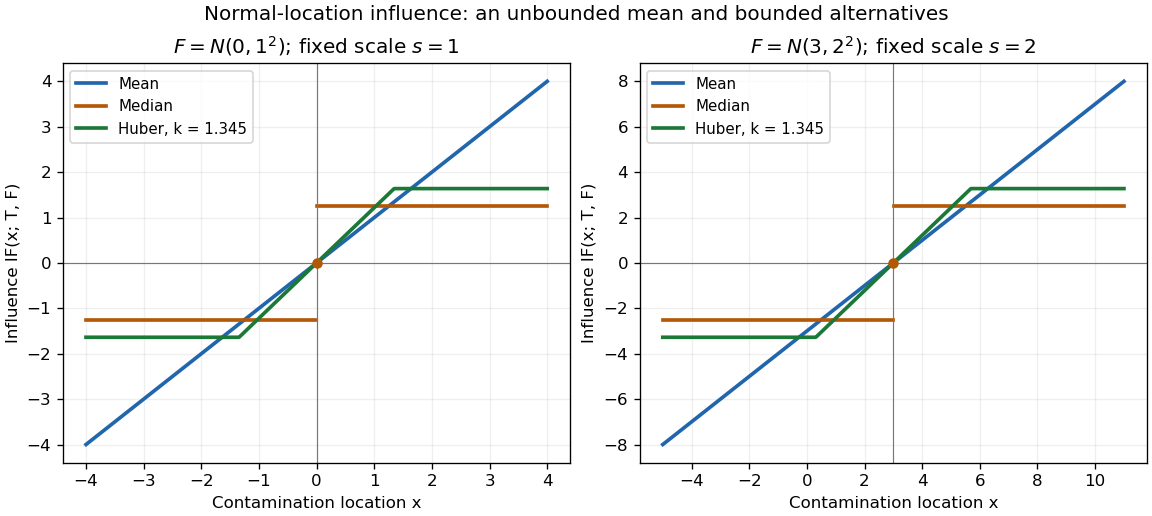

Both panels are theoretical normal distributions, with no sampled or observed data. Doubling doubles the vertical influence function scale and the horizontal clipping distance. Changing translates the curves. The isolated dot marks the actual median derivative at the center; connecting its two tails by a vertical segment would misrepresent that value. Bounded influence does not mean every small residual has less effect than on the mean: the central Huber slope is , a price paid for reducing sensitivity in the tails.
Articles by others on the same topic
There are currently no matching articles.