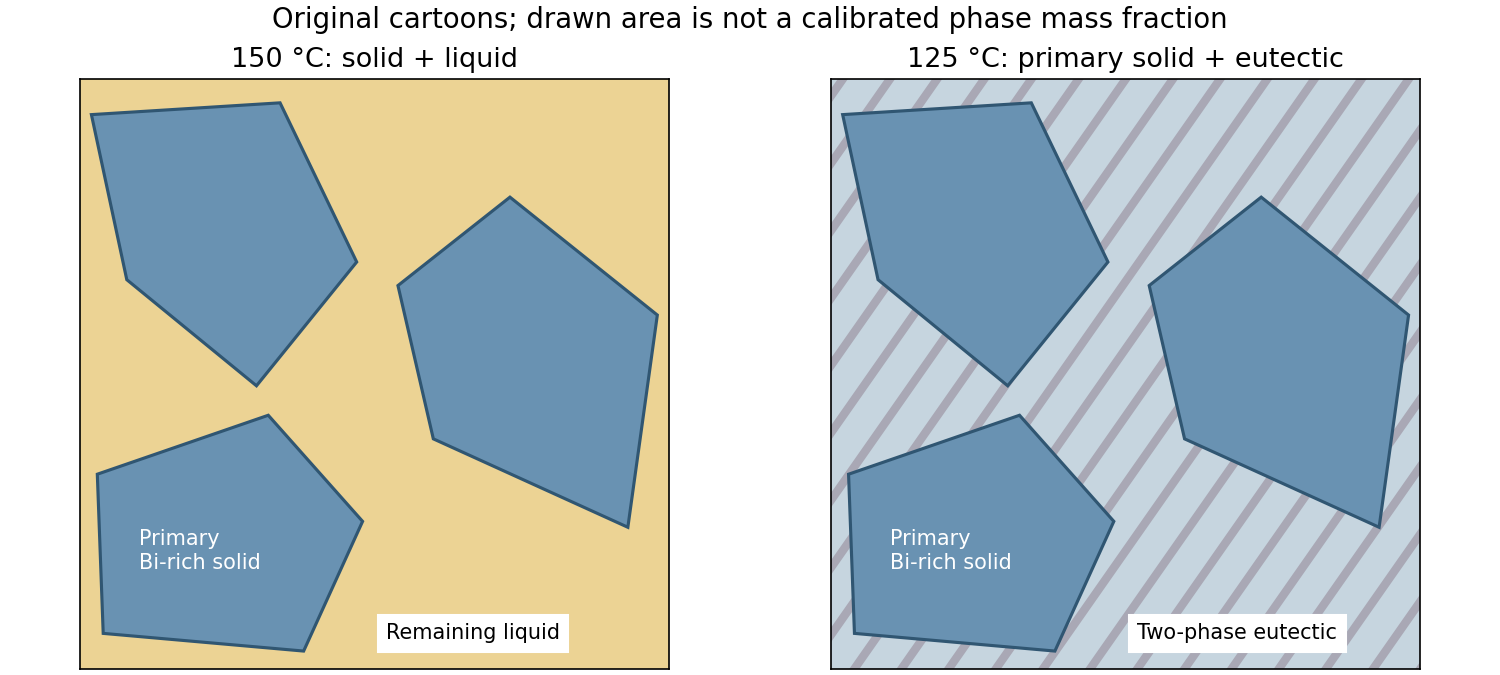
Convert atomic fractions to mass fractions before using the diagram's weight-percent scale:With and , the overall is Sn. At , the diagram gives approximately and . These are about and Sn. The lever rule givesThe microstructure has primary Bi-rich crystals surrounded by remaining liquid. The phase compositions and fractions are approximate readings of a printed phase diagram, not exact thermodynamic values. Faster cooling generally gives finer crystals, solute segregation and departure from these equilibrium compositions.
At , primary Bi-rich crystals are surrounded by a transformed two-phase eutectic microstructure. Reading approximately and gives phase compositions and Sn. Consequently,These are total phase mass fractions, including both primary and eutectic material. They differ from the microconstituent fractions: just before the eutectic reaction, roughly by mass is liquid and subsequently becomes the eutectic constituent, with roughly primary Bi-rich material. Further slow cooling changes the phase compositions and allows secondary precipitation. Faster cooling usually refines the primary crystals and eutectic spacing and increases retained segregation; the equilibrium diagram does not specify the resulting nonequilibrium fractions uniquely.

Articles by others on the same topic
There are currently no matching articles.