(Bi) and are Bi-rich and Sn-rich terminal solid solutions, not intermetallic compounds. At the eutectic composition, cooling through givesThe two solids grow together as a fine eutectic microstructure, commonly lamellar or rod-like. Below about , the tin-rich component has an equilibrium tendency to transform from metallic tetragonal white tin to diamond-cubic grey tin, with a substantial volume increase. This is tin pest, which can disrupt the microstructure mechanically. The dashed transition does not transform the Bi-rich phase into tin. Actual transformation can be slow and depend strongly on impurities and nucleation; crossing the line does not guarantee immediate disintegration.
For a mixture with phase compositions , its molar Gibbs free energy is the straight-line combination at overall . Minimizing over phase compositions gives equal slopes and equal tangent intercepts: the common-tangent construction expresses equality of both component chemical potentials. The equilibrium curve is the lower convex envelope of the candidate phase curves. Phase fractions follow the lever rule.
At , moving from Bi-rich to Sn-rich composition gives , , , , . Approximate liquid coexistence compositions read from the diagram are on the left and on the right; the coexisting solids lie near their respective pure ends. The stable Gibbs free energy follows solid curves near the endpoints, two common-tangent constructions in the coexistence intervals, and the liquid curve between them.
At , one line is tangent to all three Gibbs free energy curves at approximately for (Bi), for liquid, and for . These three phases can coexist at the eutectic point. Between the two solid compositions, the equilibrium phase fractions depend on how much liquid has already transformed; exactly at the invariant temperature, the overall composition alone does not fix all three fractions. At the eutectic overall composition, cooling just below the temperature eliminates the liquid and leaves the two solids.
At , the stable sequence is , , . The stable two-solid common tangent lies below the liquid curve. There is no stable liquid interval, although a metastable extrapolated liquid Gibbs free energy can still be drawn.
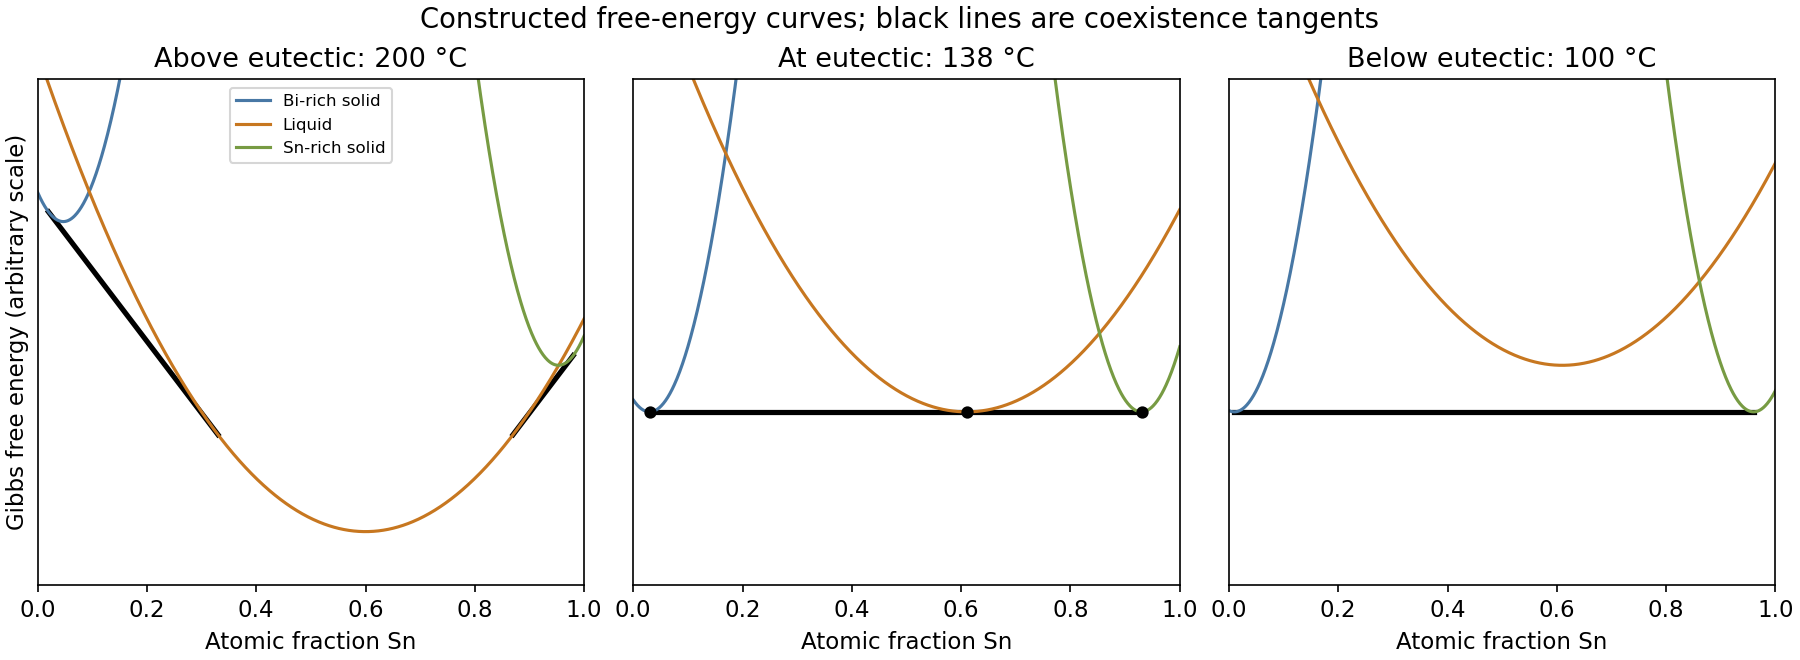
Qualitative Gibbs free-energy envelopes above, at and below a binary eutectic
. Original illustrative curves with constructed tangencies. Free-energy units and curvatures are arbitrary, not measured thermodynamic data for bismuth-tin. Details.
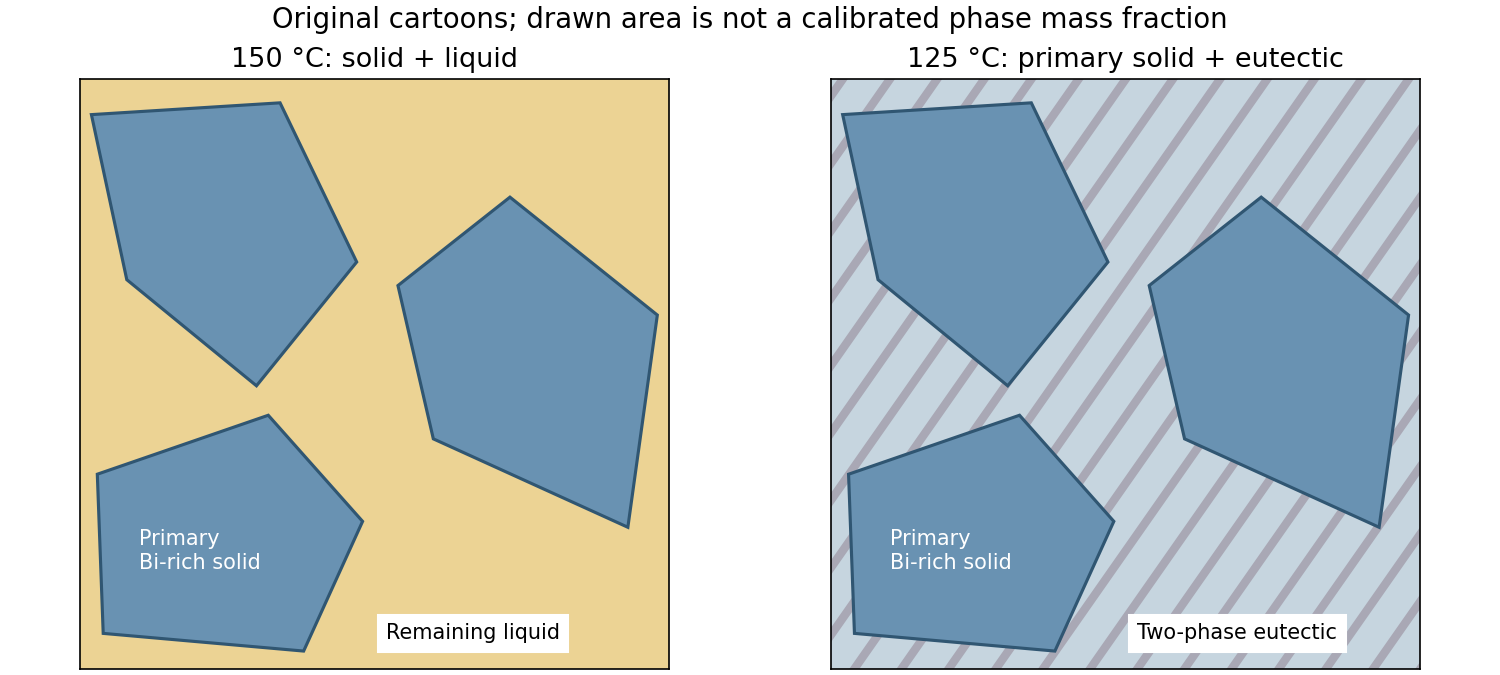
Convert atomic fractions to mass fractions before using the diagram's weight-percent scale:With and , the overall is Sn. At , the diagram gives approximately and . These are about and Sn. The lever rule givesThe microstructure has primary Bi-rich crystals surrounded by remaining liquid. The phase compositions and fractions are approximate readings of a printed phase diagram, not exact thermodynamic values. Faster cooling generally gives finer crystals, solute segregation and departure from these equilibrium compositions.
At , primary Bi-rich crystals are surrounded by a transformed two-phase eutectic microstructure. Reading approximately and gives phase compositions and Sn. Consequently,These are total phase mass fractions, including both primary and eutectic material. They differ from the microconstituent fractions: just before the eutectic reaction, roughly by mass is liquid and subsequently becomes the eutectic constituent, with roughly primary Bi-rich material. Further slow cooling changes the phase compositions and allows secondary precipitation. Faster cooling usually refines the primary crystals and eutectic spacing and increases retained segregation; the equilibrium diagram does not specify the resulting nonequilibrium fractions uniquely.

Articles by others on the same topic
There are currently no matching articles.